Wolfram Language Paclet Repository

Community-contributed installable additions to the Wolfram Language

Primary Navigation

    • Cloud & Deployment
    • Core Language & Structure
    • Data Manipulation & Analysis
    • Engineering Data & Computation
    • External Interfaces & Connections
    • Financial Data & Computation
    • Geographic Data & Computation
    • Geometry
    • Graphs & Networks
    • Higher Mathematical Computation
    • Images
    • Knowledge Representation & Natural Language
    • Machine Learning
    • Notebook Documents & Presentation
    • Scientific and Medical Data & Computation
    • Social, Cultural & Linguistic Data
    • Strings & Text
    • Symbolic & Numeric Computation
    • System Operation & Setup
    • Time-Related Computation
    • User Interface Construction
    • Visualization & Graphics
    • Random Paclet
    • Alphabetical List
  • Using Paclets
    • Get Started
    • Download Definition Notebook
  • Learn More about Wolfram Language

ReliabilityTools

Guides

  • Reliability Tools

Tech Notes

  • Outlier detection for financial time series
  • Weibull Reliability Modeling for Plant Production

Symbols

  • AnomalyDetectionInterface
  • AnomalyFinder
  • CrowAMSAAForecast
  • GNNMonAnomalyDetection
  • GNNMonAnomalyDetector
  • GrowthTrackingPlot
  • IngestSeeqData
  • IngestXMLData
  • ReliabilityModel
  • SimpleAnomalyDetection
  • WeibullReliabilityModel
  • WeibullReliabilityPlot
Weibull Reliability Modeling for Plant Production
Introduction
Weibull models
Theoretical background
Model refinements
Data model
References
Experimental data generation
​
Introduction
In this document is illustrated how to use Weibull Reliability tools/functions provided by the paclet
AntonAntonov/ReliabilityTools
. The featured paclet functions are
WeibullReliabilityModel
and
WeibullReliabilityPlot
.
The document have sections corresponding to the following steps:
◼
  • Theoretical background
  • ◼
  • Data generation
  • ◼
  • For one production plant over a range of years
  • ◼
  • Derivation of Weibull models
  • Setup

    Install and load the paclet
    In[186]:=
    PacletInstall["AntonAntonov/ReliabilityTools"];​​Needs["AntonAntonov`ReliabilityTools`"];
    Load the "TypeSystem" paclet in order get concise summaries of the data
    In[188]:=
    Needs["TypeSystem`"];
    Theoretical background
    Problem formulation: Assuming production data for different years plot the time evolution of the Weibull model knee point.
    Remark: From regression (i.e. model fitting) point of view the Weibull plot knee is a structural break.
    Data model
    Consider the following setup scenario:
    ◼
  • Simulated is the weekly output of a set of nPlants independent production lines over
    k
    weeks.
  • ◼
  • Each plant starts from a common baseline of
    nUnits
    units per week and follows two superimposed effects over time.
  • ◼
  • For each plant there is a plant-specific random weekly multiplicative gain which:
  • ◼
  • Is drawn from
    NormalDistribution
    [0.002,0.001]
  • ◼
  • Compounds week-on-week
  • ◼
  • Represents idiosyncratic learning/ productivity improvement
  • ◼
  • Independently, each plant draws a random “time-to-degradation” from a
    WeibullDistribution
    [2.5,45]
    distribution.
  • ◼
  • Until that failure time is reached the plant produces only under the improvement factor; once
    t
    exceeds the plant’s failure time an additional exponential decay kicks in at a plant-specific rate drawn from
    UniformDistribution
    [{0.005,0.025}]
    per week, applied to the improvement-adjusted baseline.
  • ◼
  • The realized weekly output for plant
    i
    at week
    t
    is the baseline
    nUnits
    multiplied by
    (1+improvement_i)^t
    and, after failure, by
    Exp[−
    degradationRate
    i
    *Max[0,t−
    failureTime
    i
    ]]
    , rounded to an integer.
  • ◼
  • Of interest is the cross-section of outputs at week
    52
    and the full
    (0,1,...,k)
    weekly histories for all plants.
  • Code for the data model

    Random seed setup (for reproducible results)
    In[189]:=
    SeedRandom[1234];
    Parameters:
    In[190]:=
    nPlants=100;​​nUnits=1200;(*Initialweeklyproduction*)​​k=52;(*Numberofweeks*)​​beta=2.5;(*Weibullshape*)​​eta=45;(*Weibullcharacteristiclife*)
    Time until production degradation
    In[195]:=
    failureTimes=RandomVariate[WeibullDistribution[beta,eta],nPlants];
    Weekly productivity improvement
    In[196]:=
    improvements=RandomVariate[NormalDistribution[0.002,0.001],nPlants];
    Weekly production degradation factors
    In[197]:=
    degradationRates=RandomVariate[UniformDistribution[{0.005,0.025}],nPlants];
    Production of plant
    i
    at week
    t
    In[198]:=
    Clear[Production];​​Production[i_,t_]:=Round[nUnits(1+improvements〚i〛)^t*Exp[-degradationRates〚i〛Max[0,t-failureTimes〚i〛]]];
    Production after
    k
    weeks
    In[200]:=
    productionAtWeek52=Table[Production[i,k],{i,nPlants}];
    Complete production histories
    In[201]:=
    productionHistories=Table[Production[i,t],{i,nPlants},{t,0,k}];

    Definitions

    Helper function that computes the plant production for given:
    - Plant index
    - Time (week index)
    - Plant improvements factors
    - Plant degradation rates
    - Failure times
    In[202]:=
    Clear[Production];​​Production[i_,t_,n_?IntegerQ,improvements:{_?NumericQ..},degradationRates:{_?NumericQ..},failureTimes:{_?NumericQ..}]:=Round[n(1+improvements〚i〛)^t*Exp[-degradationRates〚i〛Max[0,t-failureTimes〚i〛]]​​]/;Length[improvements]Length[degradationRates]Length[failureTimes];
    Function that generates plant production numbers of units for given:
    - Number of plants
    - Expected weekly production
    - Number of weeks
    - Weibull distribution parameters
    In[204]:=
    Clear[ProductionDataGeneration];​​ProductionDataGeneration[nPlants_:100,weeklyProductionPerPlant_:1000,numberOfWeeks_:52,beta_:2.5,eta_:45]:=​​Module[{failureTimes,improvements,degradationRates,productionAtLastWeek,productionHistories},​​failureTimes=RandomVariate[WeibullDistribution[beta,eta],nPlants];​​improvements=RandomVariate[NormalDistribution[0.002,0.001],nPlants];​​degradationRates=RandomVariate[UniformDistribution[{0.005,0.025}],nPlants];​​​​productionAtLastWeek=Table[Production[i,numberOfWeeks,weeklyProductionPerPlant,improvements,degradationRates,failureTimes],{i,nPlants}];​​productionHistories=Table[Production[i,t,weeklyProductionPerPlant,improvements,degradationRates,failureTimes],{i,nPlants},{t,0,numberOfWeeks}];​​​​productionHistories​​];
    Experimental data generation
    With functions defined above the generation of data for the production of one plant over a span of ten years is straightforward.
    Data production for
    1
    plant at week
    52
    In[206]:=
    productionAtWeek52=First@ProductionDataGeneration[1,nUnits,52,2.5,45]
    Out[206]=
    {1200,1201,1203,1205,1206,1208,1209,1211,1212,1214,1215,1217,1218,1220,1221,1223,1224,1226,1227,1229,1230,1232,1233,1235,1237,1238,1240,1241,1243,1244,1246,1247,1249,1250,1252,1254,1255,1257,1258,1260,1261,1263,1265,1266,1268,1269,1271,1273,1274,1276,1277,1279,1281}
    Plants below/above initial production
    In[207]:=
    Counts[Which[#<nUnits,"Below",#>nUnits,"Above",True,"Equal"]&/@productionAtWeek52]
    Out[207]=
    Equal1,Above52
    Summary statistics
    In[208]:=
    "Mean"Mean[productionAtWeek52],"Median"Median[productionAtWeek52],"Minimum"Min[productionAtWeek52],"Maximum"Max[productionAtWeek52],"Total"Total[productionAtWeek52]
    Out[208]=
    Mean
    65713
    53
    ,Median1240,Minimum1200,Maximum1281,Total65713
    Make the production history for
    12
    years:
    In[209]:=
    productionHistories=Table[First@ProductionDataGeneration[1,nUnits,52,2.5,eta],{eta,Round@Sort@RandomVariate[UniformDistribution[{30,40}],12]}];​​DeduceType[productionHistories]
    Out[210]=
    Vector[Vector[Atom[Integer],53],12]
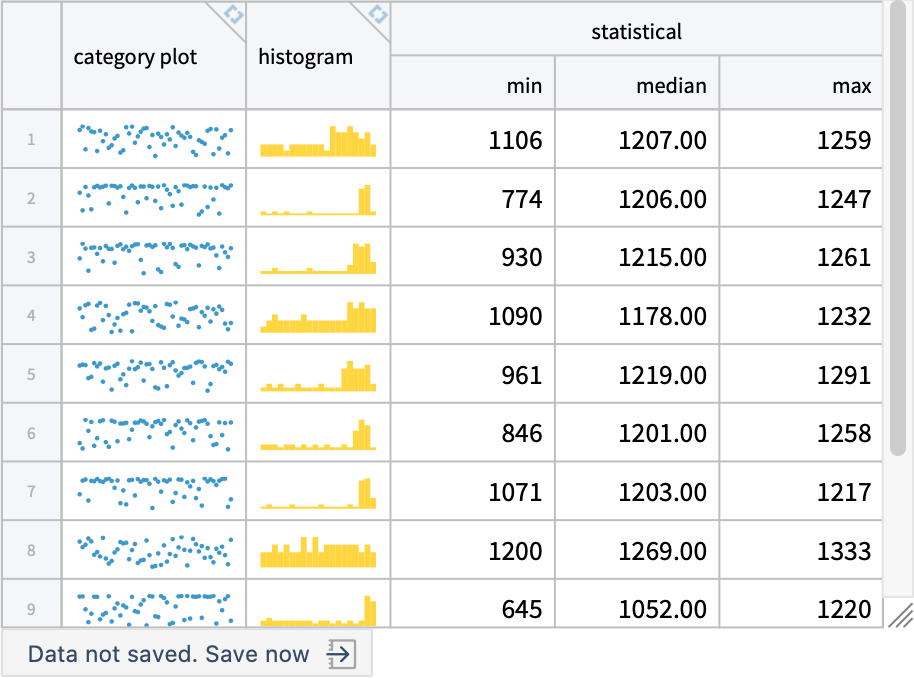
    Summarize the data (each row corresponds to a year):
    In[211]:=
    TabularSummary@Tabular[Transpose@productionHistories]
    Out[211]=
    Weibull models
    Make a reliability model for each year:
    List plot the top breakpoint and the Weibull-last (rightmost) breakpoint
    For each model give the corresponding Weibull plot
    Model refinements
    As it can be seen in the collection of plots above, for some data and models the Weibull knee point is not placed in a expected location. For example:
    Remove smallest numbers, remodel, and plot
    References

    Articles, blog posts

    [AA1] Anton Antonov, "Finding all structural breaks in time series", (2019), Wolfram Community.

    Packages

    [AAp1] Anton Antonov, ReliabilityTools, Wolfram Language paclet, (2024-2026), Wolfram Language Paclet Repository.
    [AAp2] Anton Antonov, MonadicQuantileRegression, Wolfram Language paclet, (2023-2026), Wolfram Language Paclet Repository.

    © 2026 Wolfram. All rights reserved.

    • Legal & Privacy Policy
    • Contact Us
    • WolframAlpha.com
    • WolframCloud.com