Wolfram Language
Paclet Repository
Community-contributed installable additions to the Wolfram Language
Primary Navigation
Categories
Cloud & Deployment
Core Language & Structure
Data Manipulation & Analysis
Engineering Data & Computation
External Interfaces & Connections
Financial Data & Computation
Geographic Data & Computation
Geometry
Graphs & Networks
Higher Mathematical Computation
Images
Knowledge Representation & Natural Language
Machine Learning
Notebook Documents & Presentation
Scientific and Medical Data & Computation
Social, Cultural & Linguistic Data
Strings & Text
Symbolic & Numeric Computation
System Operation & Setup
Time-Related Computation
User Interface Construction
Visualization & Graphics
Random Paclet
Alphabetical List
Using Paclets
Create a Paclet
Get Started
Download Definition Notebook
Learn More about
Wolfram Language
ReliabilityTools
Guides
Reliability Tools
Tech Notes
Outlier detection for financial time series
Symbols
AnomalyDetectionInterface
AnomalyFinder
CrowAMSAAForecast
GNNMonAnomalyDetection
GNNMonAnomalyDetector
GrowthTrackingPlot
IngestSeeqData
IngestXMLData
SimpleAnomalyDetection
AntonAntonov`ReliabilityTools`
A
n
o
m
a
l
y
F
i
n
d
e
r
A
n
o
m
a
l
y
F
i
n
d
e
r
[
d
a
t
a
]
f
i
n
d
s
a
n
o
m
a
l
i
e
s
i
n
d
a
t
a
.
A
n
o
m
a
l
y
F
i
n
d
e
r
[
t
r
a
i
n
i
n
g
D
a
t
a
,
n
e
w
D
a
t
a
]
f
i
n
d
s
a
n
o
m
a
l
i
e
s
i
n
n
e
w
D
a
t
a
b
a
s
e
d
o
n
o
b
s
e
r
v
a
t
i
o
n
s
f
r
o
m
t
r
a
i
n
i
n
g
D
a
t
a
.
A
n
o
m
a
l
y
F
i
n
d
e
r
[
t
r
a
i
n
i
n
g
D
a
t
a
,
n
e
w
D
a
t
a
,
p
r
o
p
s
]
g
i
v
e
s
t
h
e
s
p
e
c
i
f
i
e
d
p
r
o
p
e
r
t
i
e
s
.
D
e
t
a
i
l
s
a
n
d
O
p
t
i
o
n
s
Examples
(
3
)
Basic Examples
(
1
)
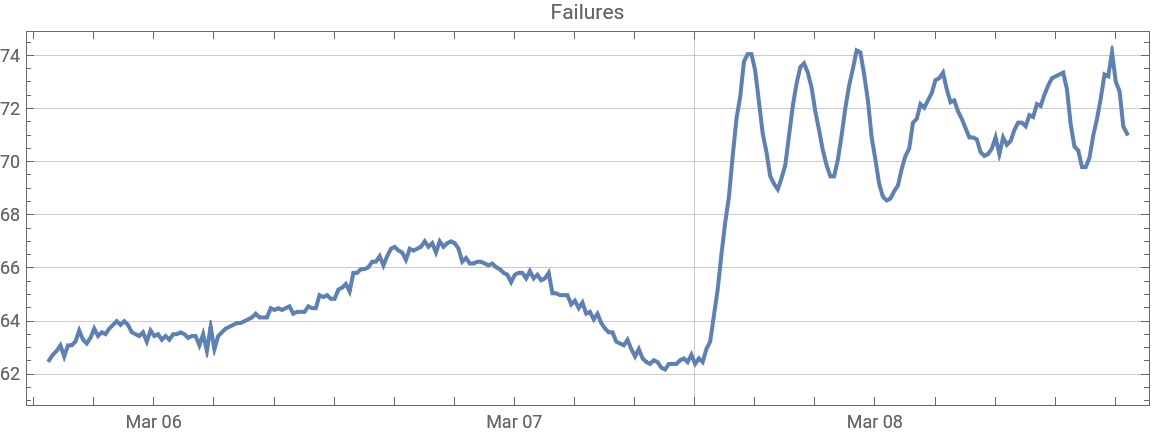
Here is a time series and its length:
I
n
[
1
]
:
=
t
s
D
a
t
a
=
T
i
m
e
S
e
r
i
e
s
T
i
m
e
:
0
5
M
a
r
2
0
2
4
t
o
0
8
M
a
r
2
0
2
4
D
a
t
a
p
o
i
n
t
s
:
2
8
8
R
e
g
u
l
a
r
:
T
r
u
e
O
u
t
p
u
t
d
i
m
e
n
s
i
o
n
:
1
M
e
t
a
d
a
t
a
:
N
o
n
e
M
i
n
i
m
u
m
i
n
c
r
e
m
e
n
t
:
{
1
5
,
M
i
n
u
t
e
}
R
e
s
a
m
p
l
i
n
g
:
{
I
n
t
e
r
p
o
l
a
t
i
o
n
,
1
}
;
Here is a date list plot with a vertical grid line that marks the training and testing split date:
I
n
[
2
]
:
=
s
p
l
i
t
D
a
t
e
=
D
a
t
e
O
b
j
e
c
t
[
{
2
0
2
4
,
3
,
7
,
1
2
,
0
,
0
}
]
;
p
l
=
D
a
t
e
L
i
s
t
P
l
o
t
[
t
s
D
a
t
a
,
A
s
p
e
c
t
R
a
t
i
o
1
/
3
,
I
m
a
g
e
S
i
z
e
L
a
r
g
e
,
P
l
o
t
L
a
b
e
l
"
F
a
i
l
u
r
e
s
"
,
G
r
i
d
L
i
n
e
s
{
{
s
p
l
i
t
D
a
t
e
}
,
A
u
t
o
m
a
t
i
c
}
]
O
u
t
[
2
]
=
Here we split the data into training and testing parts:
I
n
[
3
]
:
=
s
p
l
i
t
P
o
s
=
L
e
n
g
t
h
@
S
e
l
e
c
t
[
t
s
D
a
t
a
[
"
T
i
m
e
s
"
]
,
#
≤
A
b
s
o
l
u
t
e
T
i
m
e
[
s
p
l
i
t
D
a
t
e
]
&
]
;
{
t
r
a
i
n
i
n
g
,
t
e
s
t
i
n
g
}
=
T
a
k
e
D
r
o
p
[
Q
u
a
n
t
i
t
y
M
a
g
n
i
t
u
d
e
[
t
s
D
a
t
a
[
"
P
a
t
h
"
]
]
,
s
p
l
i
t
P
o
s
]
;
L
e
n
g
t
h
/
@
{
t
r
a
i
n
i
n
g
,
t
e
s
t
i
n
g
}
O
u
t
[
3
]
=
{
1
7
3
,
1
1
5
}
Here we get the positions of the anomalies:
I
n
[
4
]
:
=
A
n
o
m
a
l
y
F
i
n
d
e
r
[
{
t
r
a
i
n
i
n
g
〚
A
l
l
,
2
〛
,
t
e
s
t
i
n
g
〚
A
l
l
,
2
〛
}
,
M
e
t
h
o
d
{
A
u
t
o
m
a
t
i
c
,
"
O
u
t
l
i
e
r
I
d
e
n
t
i
f
i
e
r
"
"
Q
u
a
r
t
i
l
e
"
}
]
I
n
[
5
]
:
=
A
n
o
m
a
l
y
F
i
n
d
e
r
[
{
t
r
a
i
n
i
n
g
〚
A
l
l
,
2
〛
,
t
e
s
t
i
n
g
〚
A
l
l
,
2
〛
}
,
"
O
u
t
l
i
e
r
I
d
e
n
t
i
f
i
e
r
"
"
Q
u
a
r
t
i
l
e
"
]
I
n
[
6
]
:
=
p
o
s
=
A
n
o
m
a
l
y
F
i
n
d
e
r
[
{
t
r
a
i
n
i
n
g
〚
A
l
l
,
2
〛
,
t
e
s
t
i
n
g
〚
A
l
l
,
2
〛
}
,
"
A
n
o
m
a
l
y
P
o
s
i
t
i
o
n
s
"
,
M
e
t
h
o
d
{
"
G
N
N
M
o
n
"
,
"
N
u
m
b
e
r
O
f
N
e
a
r
e
s
t
N
e
i
g
h
b
o
r
s
"
1
0
,
"
O
u
t
l
i
e
r
I
d
e
n
t
i
f
i
e
r
"
"
Q
u
a
r
t
i
l
e
"
}
]
;
S
h
a
l
l
o
w
[
p
o
s
]
O
u
t
[
6
]
/
/
S
h
a
l
l
o
w
=
{
1
,
2
,
3
,
4
,
5
,
6
,
7
,
8
,
9
,
1
0
,
9
8
}
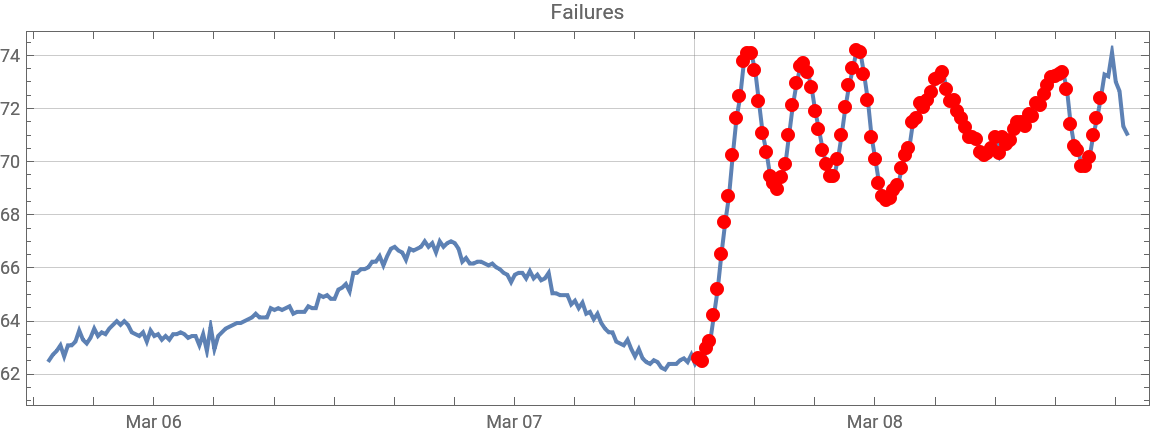
Here is a plot of the time series and the found outliers:
I
n
[
7
]
:
=
A
p
p
e
n
d
[
p
l
,
E
p
i
l
o
g
{
R
e
d
,
P
o
i
n
t
S
i
z
e
[
0
.
0
1
2
]
,
P
o
i
n
t
[
t
e
s
t
i
n
g
〚
p
o
s
〛
]
}
]
O
u
t
[
7
]
=
O
p
t
i
o
n
s
(
2
)
S
e
e
A
l
s
o
G
N
N
M
o
n
A
n
o
m
a
l
y
D
e
t
e
c
t
o
r
R
e
l
a
t
e
d
G
u
i
d
e
s
▪
R
e
l
i
a
b
i
l
i
t
y
T
o
o
l
s
"
"