Wolfram Language
Paclet Repository
Community-contributed installable additions to the Wolfram Language
Primary Navigation
Categories
Cloud & Deployment
Core Language & Structure
Data Manipulation & Analysis
Engineering Data & Computation
External Interfaces & Connections
Financial Data & Computation
Geographic Data & Computation
Geometry
Graphs & Networks
Higher Mathematical Computation
Images
Knowledge Representation & Natural Language
Machine Learning
Notebook Documents & Presentation
Scientific and Medical Data & Computation
Social, Cultural & Linguistic Data
Strings & Text
Symbolic & Numeric Computation
System Operation & Setup
Time-Related Computation
User Interface Construction
Visualization & Graphics
Random Paclet
Alphabetical List
Using Paclets
Create a Paclet
Get Started
Download Definition Notebook
Learn More about
Wolfram Language
MosaicPlot
Tech Notes
Mosaic plots for data visualization
Mosaic plots for numerical variables via categorical mapping
Symbols
MakeTooltipTable
MosaicPlot
Mosaic plots for numerical variables via categorical mapping
In this notebook we show how to transform numerical variables into categorical in order to get more informative mosaic plots.
Load the paclet
I
n
[
5
2
]
:
=
N
e
e
d
s
[
"
A
n
t
o
n
A
n
t
o
n
o
v
`
M
o
s
a
i
c
P
l
o
t
`
"
]
Here we get the Titanic dataset:
I
n
[
5
3
]
:
=
d
s
T
i
t
a
n
i
c
=
R
e
s
o
u
r
c
e
F
u
n
c
t
i
o
n
[
"
E
x
a
m
p
l
e
D
a
t
a
s
e
t
"
]
[
{
"
M
a
c
h
i
n
e
L
e
a
r
n
i
n
g
"
,
"
T
i
t
a
n
i
c
"
}
]
O
u
t
[
5
3
]
=
p
a
s
s
e
n
g
e
r
c
l
a
s
s
p
a
s
s
e
n
g
e
r
a
g
e
p
a
s
s
e
n
g
e
r
s
e
x
p
a
s
s
e
n
g
e
r
s
u
r
v
i
v
a
l
1
s
t
2
9
.
0
f
e
m
a
l
e
s
u
r
v
i
v
e
d
1
s
t
0
.
9
1
6
7
m
a
l
e
s
u
r
v
i
v
e
d
1
s
t
2
.
0
f
e
m
a
l
e
d
i
e
d
1
s
t
3
0
.
0
m
a
l
e
d
i
e
d
1
s
t
2
5
.
0
f
e
m
a
l
e
d
i
e
d
1
s
t
4
8
.
0
m
a
l
e
s
u
r
v
i
v
e
d
1
s
t
6
3
.
0
f
e
m
a
l
e
s
u
r
v
i
v
e
d
1
s
t
3
9
.
0
m
a
l
e
d
i
e
d
1
s
t
5
3
.
0
f
e
m
a
l
e
s
u
r
v
i
v
e
d
1
s
t
7
1
.
0
m
a
l
e
d
i
e
d
1
s
t
4
7
.
0
m
a
l
e
d
i
e
d
1
s
t
1
8
.
0
f
e
m
a
l
e
s
u
r
v
i
v
e
d
1
s
t
2
4
.
0
f
e
m
a
l
e
s
u
r
v
i
v
e
d
1
s
t
2
6
.
0
f
e
m
a
l
e
s
u
r
v
i
v
e
d
1
s
t
8
0
.
0
m
a
l
e
s
u
r
v
i
v
e
d
1
s
t
—
m
a
l
e
d
i
e
d
1
s
t
2
4
.
0
m
a
l
e
d
i
e
d
1
s
t
5
0
.
0
f
e
m
a
l
e
s
u
r
v
i
v
e
d
1
s
t
3
2
.
0
f
e
m
a
l
e
s
u
r
v
i
v
e
d
1
s
t
3
6
.
0
m
a
l
e
d
i
e
d
r
o
w
s
1
–
2
0
o
f
1
3
0
9
Here is a mosaic plot of passenger class vs. passenger age:
I
n
[
5
4
]
:
=
M
o
s
a
i
c
P
l
o
t
[
d
s
T
i
t
a
n
i
c
[
A
l
l
,
{
"
p
a
s
s
e
n
g
e
r
c
l
a
s
s
"
,
"
p
a
s
s
e
n
g
e
r
a
g
e
"
}
]
]
O
u
t
[
5
4
]
=
The plot is not very informative
Here we make a mapping function of the numerical variable "passenger age" into "categorical age" integers (factors):
I
n
[
5
5
]
:
=
f
a
c
t
o
r
=
P
i
e
c
e
w
i
s
e
[
{
{
1
,
-
I
n
f
i
n
i
t
y
<
#
#
1
≤
5
}
,
{
2
,
5
<
#
#
1
≤
1
4
}
,
{
3
,
1
4
<
#
#
1
≤
2
1
}
,
{
4
,
2
1
<
#
#
1
≤
2
8
}
,
{
5
,
2
8
<
#
#
1
≤
3
5
}
,
{
6
,
3
5
<
#
#
1
≤
5
0
}
,
{
7
,
5
0
<
#
#
1
≤
I
n
f
i
n
i
t
y
}
}
,
0
]
&
;
Here we make a list of rules that map the categorical integers (factors) into (informative) labels:
I
n
[
5
6
]
:
=
a
F
a
c
t
o
r
L
a
b
e
l
=
{
1
"
1
(
u
n
d
e
r
6
)
"
,
2
"
2
(
6
.
.
.
1
4
)
"
,
3
"
3
(
1
5
.
.
.
2
1
)
"
,
4
"
4
(
2
2
.
.
.
]
2
8
)
"
,
5
"
5
(
2
9
.
.
.
3
5
)
"
,
6
"
6
(
3
6
.
.
.
5
0
)
"
,
7
"
7
(
5
0
+
)
"
,
0
"
0
(
m
i
s
s
i
n
g
)
"
}
;
Here we add the column "AgeFactor" that has the mapped values of "passenger age":
I
n
[
5
7
]
:
=
d
s
T
i
t
a
n
i
c
2
=
d
s
T
i
t
a
n
i
c
[
A
l
l
,
#
,
"
A
g
e
F
a
c
t
o
r
"
I
f
[
H
e
a
d
[
#
[
"
p
a
s
s
e
n
g
e
r
a
g
e
"
]
]
=
=
=
M
i
s
s
i
n
g
,
0
,
f
a
c
t
o
r
[
#
[
"
p
a
s
s
e
n
g
e
r
a
g
e
"
]
]
]
/
.
a
F
a
c
t
o
r
L
a
b
e
l
&
]
;
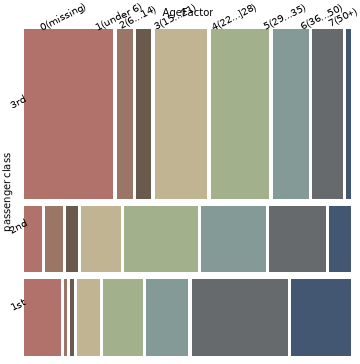
Here is the mosaic plot of passenger class vs. categorical passenger age:
I
n
[
5
9
]
:
=
M
o
s
a
i
c
P
l
o
t
[
d
s
T
i
t
a
n
i
c
2
[
A
l
l
,
{
"
p
a
s
s
e
n
g
e
r
c
l
a
s
s
"
,
"
A
g
e
F
a
c
t
o
r
"
}
]
,
"
L
a
b
e
l
R
o
t
a
t
i
o
n
"
{
1
,
0
.
5
}
,
I
m
a
g
e
S
i
z
e
M
e
d
i
u
m
]
O
u
t
[
5
9
]
=
The second mosaic plot is more informative.
"
"