Wolfram Language Paclet Repository

Community-contributed installable additions to the Wolfram Language
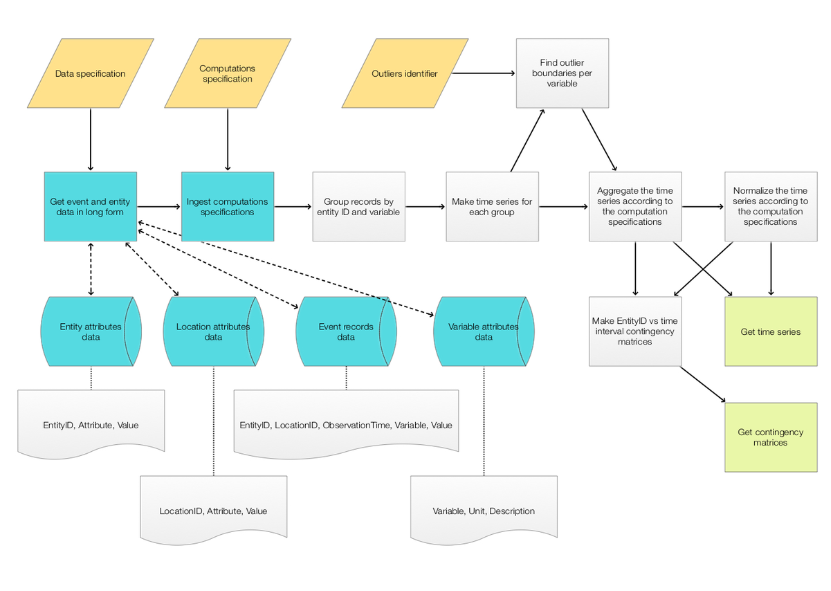
Primary Navigation

    • Cloud & Deployment
    • Core Language & Structure
    • Data Manipulation & Analysis
    • Engineering Data & Computation
    • External Interfaces & Connections
    • Financial Data & Computation
    • Geographic Data & Computation
    • Geometry
    • Graphs & Networks
    • Higher Mathematical Computation
    • Images
    • Knowledge Representation & Natural Language
    • Machine Learning
    • Notebook Documents & Presentation
    • Scientific and Medical Data & Computation
    • Social, Cultural & Linguistic Data
    • Strings & Text
    • Symbolic & Numeric Computation
    • System Operation & Setup
    • Time-Related Computation
    • User Interface Construction
    • Visualization & Graphics
    • Random Paclet
    • Alphabetical List
  • Using Paclets
    • Get Started
    • Download Definition Notebook
  • Learn More about Wolfram Language

MonadicEventRecordsTransformations

Guides

  • Monadic Event Records Transformations

Tech Notes

  • Parameterized Event Records Data Transformations

Symbols

  • EmptyComputationSpecificationRow
  • ERTMonAddToContext
  • ERTMonAggregateTimeSeries
  • ERTMonApplyTimeSeriesFunction
  • ERTMonAssignContextTo
  • ERTMonAssignTo
  • ERTMonAssignValueTo
  • ERTMonBind
  • ERTMonComputeVariableStatistic
  • ERTMonContexts
  • ERTMonDropComputationSpecification
  • ERTMonDropContingencyMatrices
  • ERTMonDropEntityAttributes
  • ERTMonDropEntityVariableRecordGroups
  • ERTMonDropEventRecords
  • ERTMonDropFromContext
  • ERTMonDropNormalizationValues
  • ERTMonDropTimeSeries
  • ERTMonDropVariableOutlierBoundaries
  • ERTMonEchoContext
  • ERTMonEchoDataSummary
  • ERTMonEchoFunctionContext
  • ERTMonEchoFunctionValue
  • ERTMonEcho
  • ERTMonEchoValue
  • ERTMonEntityVariableGroupsToTimeSeries
  • ERTMonFail
  • ERTMonFindNormalizationValue
  • ERTMonFindVariableOutlierBoundaries
  • ERTMonFold
  • ERTMonGroupEntityVariableRecords
  • ERTMonIfElse
  • ERTMonIf
  • ERTMonIterate
  • ERTMonMakeContingencyMatrices
  • ERTMonMakeContingencyMatrix
  • ERTMonModifyContext
  • ERTMonModule
  • ERTMon
  • ERTMonNest
  • ERTMonNestWhile
  • ERTMonNormalize
  • ERTMonOption
  • ERTMonProcessComputationSpecification
  • ERTMonPutContext
  • ERTMonPutValue
  • ERTMonReadData
  • ERTMonRemapEntitiesByGroups
  • ERTMonRetrieveFromContext
  • ERTMonSetComputationSpecification
  • ERTMonSetContext
  • ERTMonSetContingencyMatrices
  • ERTMonSetEntityAttributes
  • ERTMonSetEntityVariableRecordGroups
  • ERTMonSetEventRecords
  • ERTMonSetNormalizationValues
  • ERTMonSetTimeSeries
  • ERTMonSetValue
  • ERTMonSetVariableOutlierBoundaries
  • ERTMonSucceed
  • ERTMonTakeComputationSpecification
  • ERTMonTakeContext
  • ERTMonTakeContingencyMatrices
  • ERTMonTakeContingencyMatrix
  • ERTMonTakeEntityAttributes
  • ERTMonTakeEntityVariableRecordGroups
  • ERTMonTakeEventRecords
  • ERTMonTakeNormalizationValues
  • ERTMonTakeTimeSeries
  • ERTMonTakeValue
  • ERTMonTakeVariableOutlierBoundaries
  • ERTMonToTimeSeries
  • ERTMonUnit
  • ERTMonUnitQ
  • ERTMonWhen
  • ProcessComputationSpecification
  • WeatherEventRecords
  • $ERTMonFailure
Parameterized Event Records Data Transformations
Introduction
Event records data design
Paclet load
Monad elements
Data load
References
Design considerations
​
Introduction
In this document (notebook) we describe transformations of events records data in order to make that data more amenable for the application of Machine Learning (ML) algorithms.
Consider the following problem formulation (done with the next five bullet points.)
◼
  • From data representing a (most likely very) diverse set of events we want to derive contingency matrices corresponding to each of the variables in that data.
  • ◼
  • The events are observations of the values of a certain set of variables for a certain set of entities. Not all entities have events for all variables.
  • ◼
  • The observation times do not form a regular time grid.
  • ◼
  • Each contingency matrix has rows corresponding to the entities in the data and has columns corresponding to time.
  • ◼
  • The software component providing the functionality should allow parametrization and repeated execution. (As in ML classifier training and testing scenarios.)
  • The phrase “event records data” is used instead of “time series” in order to emphasize that (i) some variables have categorical values, and (ii) the data can be given in some general database form, like transactions long-form.
    The required transformations of the event records in the problem formulation above are done through the monad ERTMon, [
    AAp3
    ]. (The name ERTMon comes from “Event Records Transformations Monad”.)
    The monad code generation and utilization is explained in [AA1] and implemented with [AAp1].
    It is assumed that the event records data is put in a form that makes it (relatively) easy to extract time series for the set of entity-variable pairs present in that data.
    In brief ERTMon performs the following sequence of transformations.
    1
    .
    The event records of each entity-variable pair are shifted to adhere to a specified start or end point,
    2
    .
    The event records for each entity-variable pair are aggregated and normalized with specified functions over a specified regular grid,
    3
    .
    Entity vs. time interval contingency matrices are made for each combination of variable and aggregation function.
    The transformations are specified with a “computation specification” dataset.
    Here is an example of an ERTMon pipeline over event records:
    Out[248]=
    ERTMonUnit[]
    ⟹
    initialize the monad pipeline
    ERTMonSetEventRecords[eventRecords]
    ⟹
    ingest event records
    ERTMonSetEntityAttributes[entityAttributes]
    ⟹
    ingest event attributes
    ERTMonSetComputationSpecification[compSpec]
    ⟹
    ingest computation specification
    ERTMonGroupEntityVariableRecords
    ⟹
    group records per {EntityID, Variable}
    ERTMonEntityVariableGroupsToTimeSeries["MaxTime"]
    ⟹
    align the event records and create time series
    ERTMonAggregateTimeSeries
    aggregate the time series(according to the computation specification)
    The rest of the document describes in detail:
    ◼
  • the structure, format, and interpretation of the event records data and computations specifications,
  • ◼
  • the transformations of time series aligning, aggregation, and normalization,
  • ◼
  • the software pattern design -- a monad -- that allows sequential specifications of desired transformations.
  • Concrete examples are given using weather data. See [
    AAp9
    ].
    Paclet load
    Load the paclet and supporting ones
    In[92]:=
    Needs["AntonAntonov`MonadicEventRecordsTransformations`"];​​Needs["AntonAntonov`DataReshapers`"];​​Needs["AntonAntonov`OutlierIdentifiers`"];​​Needs["AntonAntonov`SSparseMatrix`"];
    Data load
    The data we use is weather data from meteorological stations close to certain major cities. We retrieve the data with the function WeatherEventRecords from the package [AAp9].
    In[18]:=
    ?
    WeatherEventRecords
    Out[18]=
    Symbol
    WeatherEventRecords[ citiesSpec_: {{_String, _String}..}, dateRange:{{_Integer, _Integer, _Integer}, {_Integer, _Integer, _Integer}}, wProps:{_String..} : {"Temperature"}, nStations_Integer : 1 ] gives an association with event records data.
    In[19]:=
    citiesSpec={{"Miami","USA"},{"Jacksonville","USA"},{"Chicago","USA"},{"London","UK"},{"Melbourne","Australia"},{"Sydney","Australia"}};​​dateRange={{2024,10,1},{2025,10,1}};​​wProps={"Temperature","MaxTemperature","Pressure","Humidity","WindSpeed"};​​res=
    WeatherEventRecords
    [citiesSpec,dateRange,wProps,0];
    Here we assign the obtained datasets to variables we use below:
    In[23]:=
    eventRecords=res["eventRecords"];​​entityAttributes=res["entityAttributes"];
    Here are the summaries of the datasets eventRecords and entityAttributes:
    In[65]:=
    RecordsSummary[eventRecords]
    Out[65]=
    
    1 EntityID
    Chicago_USA
    1621
    Jacksonville_USA
    1616
    Miami_USA
    1616
    Melbourne_Australia
    1580
    London_UK
    1264
    Sydney_Australia
    1264
    ,
    2 LocationID
    Chicago
    1621
    Jacksonville
    1616
    Miami
    1616
    Melbourne
    1580
    London
    1264
    Sydney
    1264
    ,
    3 ObservationTime
    Min
    3936729600
    1st Qu
    3943900800
    Mean
    3.95111×
    9
    10
    Median
    3951331200
    3rd Qu
    3958243200
    Max
    3965241600
    ,
    4 Variable
    Temperature
    1923
    Humidity
    1922
    MaxTemperature
    1913
    WindSpeed
    1607
    Pressure
    1596
    ,
    5 Value
    Min
    -17.67
    1st Qu
    5.61
    Median
    17.22
    3rd Qu
    27.22
    Mean
    192.135
    Max
    1039.2
    
    In[66]:=
    RecordsSummary[entityAttributes]
    Out[66]=
    
    1 EntityID
    Chicago_USA
    2
    Jacksonville_USA
    2
    London_UK
    2
    Melbourne_Australia
    2
    Miami_USA
    2
    Sydney_Australia
    2
    ,
    2 Attribute
    City
    6
    Country
    6
    ,
    3 Value
    USA
    3
    Australia
    2
    Chicago
    1
    Jacksonville
    1
    London
    1
    Melbourne
    1
    (Other)
    3
    
    Design considerations

    Workflow

    The steps of the main event records transformations workflow addressed in this document follow.
    1
    .
    Ingest event records and entity attributes given in the
    Star schema
    style.
    2
    .
    Ingest a computation specification.
    2
    .
    1
    .
    Specified are aggregation time intervals, aggregation functions, normalization types and functions.
    3
    .
    Group event records based on unique entity ID and variable pairs.
    3
    .
    1
    .
    Additional filtering can be applied using the entity attributes.
    4
    .
    For each variable find descriptive statistics properties.
    4
    .
    1
    .
    This is to facilitate normalization procedures.
    4
    .
    2
    .
    Optionally, for each variable find outlier boundaries.
    5
    .
    Align each group of records to start or finish at some specified point.
    5
    .
    1
    .
    For each variable we want to impose a regular time grid.
    6
    .
    From each group of records produce a time series.
    7
    .
    For each time series do prescribed aggregation and normalization.
    7
    .
    1
    .
    The variable that corresponds to each group of records has at least one (possibly several) computation specifications.
    8
    .
    Make a contingency matrix for each time series obtained in the previous step.
    8
    .
    1
    .
    The contingency matrices have entity ID’s as rows, and time intervals enumerating values of time intervals.
    The following flow-chart corresponds to the list of steps above.
    Out[78]=
    A corresponding monadic pipeline is given in the section “Larger example pipeline”.

    Feature engineering perspective

    The workflow above describes a way to do feature engineering over a collection of event records data. For a given entity ID and a variable we derive several different time series.
    Couple of examples follow.
    ◼
  • One possible derived feature (times series) is for each entity-variable pair we make time series of the hourly mean value in each of the eight most recent hours for that entity. The mean values are normalized by the average values of the records corresponding to that entity-variable pair.
  • ◼
  • Another possible derived feature (time series) is for each entity-variable pair to make a time series with the number of outliers in the each half-hour interval, considering the most recent 20 half-hour intervals. The outliers are found by using outlier boundaries derived by analyzing all values of the corresponding variable, across all entities.
  • From the examples above -- and some others -- we conclude that for each feature we want to be able to specify:
    ◼
  • maximum history length (say from the most recent observation),
  • ◼
  • aggregation interval length,
  • ◼
  • aggregation function (to be applied in each interval),
  • ◼
  • normalization function (per entity, per cohort of entities, per variable),
  • ◼
  • conversion of categorical values into numerical ones.
  • Repeated execution

    We want to be able to do repeated executions of the specified workflow steps.
    Consider the following scenario. After the event records data is converted to a entity-vs-feature contingency matrix, we use that matrix to train and test a classifier. We want to find the combination of features that gives the best classifier results. For that reason we want to be able to easily and systematically change the computation specifications (interval size, aggregation and normalization functions, etc.) With different computation specifications we obtain different entity-vs-feature contingency matrices, that would have different performance with different classifiers.
    Using the classifier training and testing scenario we see that there is another repeated execution perspective: after the feature engineering is done over the training data, we want to be able to execute exactly the same steps over the test data. Note that with the training data we find certain global or cohort normalization values and outlier boundaries that have to be used over the test data. (Not derived from the test data.)
    The following diagram further describes the repeated execution workflow.
    Event records data design
    The structure datasets (tables) proposed satisfy a wide range of modeling data requirements. (Medical and financial modeling included.)

    Entity event data

    The entity event data has the columns “EntityID”, “LocationID”, “ObservationTime”, “Variable”, “Value”.
    Most events can be described through “Entity event data”. The entities can be anything that produces a set of event data: financial transactions, vital sign monitors, wind speed sensors, chemical concentrations sensors.
    The locations can be anything that gives the events certain "spatial" attributes: medical units in hospitals, sensors geo-locations, tiers of financial transactions.

    Entity attributes data

    The entity attributes dataset (table) has attributes (immutable properties) of the entities. (Like, gender and race for people, longitude and latitude for wind speed sensors.)

    Example

    For example, here we take all weather stations in USA:
    Here we take all temperature event records for those weather stations:
    And here plot the corresponding time series obtained by grouping the records by station (entity ID’s) and taking the columns “ObservationTime” and ”Value”:
    Monad elements
    This section goes through the steps of the general ERTMon workflow.For didactic purposes each sub-section changes the pipeline assigned to the variable p. Of course all functions can be chained into one big pipeline as shown in the section “Larger example pipeline”.

    Monad unit

    The monad is initialized with ERTMonUnit.

    Ingesting event records and entity attributes

    The event records dataset (table) and entity attributes dataset (table) are set with corresponding setter functions. Alternatively, they can be read from files in a specified directory.

    Computation specification

    Using the package [AAp3] we can create computation specification dataset. Below is given an example of constructing a fairly complicated computation specification.
    The package EmptyComputationSpecificationRow can be used to construct the rows of the specification.
    The constructed rows are assembled into a dataset (with Dataset). The function ProcessComputationSpecification is used to convert a user-made specification dataset into a form used by ERTMon.
    The computation specification is set to the monad with the function ERTMonSetComputationSpecification.
    Alternatively, a computation specification can be created and filled-in as a CSV file and read into the monad. (Not described here.)

    Grouping event records by entity-variable pairs

    With the function ERTMonGroupEntityVariableRecords we group the event records by the found unique entity-variable pairs. Note that in the pipeline below we set the computation specification first.

    Descriptive statistics (per variable)

    After the data is ingested into the monad and the event records are grouped per entity-variable pairs we can find certain descriptive statistics for the data. This is done with the general function ERTMonComputeVariableStatistic and the specialized function ERTMonFindVariableOutlierBoundaries.

    Finding the variables outlier boundaries

    If no argument is specified ERTMonFindVariableOutlierBoundaries uses the Hampel identifier (HampelIdentifierParameters).
    In the rest of document we use the outlier boundaries found with the more conservative identifier SPLUSQuartileIdentifierParameters.

    Conversion of event records to time series

    The grouped event records are converted into time series with the function ERTMonEntityVariableGroupsToTimeSeries. The time series are aligned to a time point specification given as an argument. The argument can be: a date object, “MinTime”, “MaxTime”, or “None”. (“MaxTime” is the default.)
    Compare the last output with the output of the following command.

    Time series restriction and aggregation.

    The main goal of ERTMon is to convert a diverse, general collection of event records into a collection of aligned time series over specified regular time grids.
    The regular time grids are specified with the columns “MaxHistoryLength” and “AggregationIntervalLength” of the computation specification. The time series of the variables in the computation specification are restricted to the corresponding maximum history lengths and are aggregated using the corresponding aggregation lengths and functions.

    Application of time series functions

    At this point we can apply time series modifying functions. An often used such function is moving average.
    Note that the result is given as a pipeline value, the value of the context key ”timeSeries” is not changed.
    (In the future, the computation specification and its handling might be extended to handle moving average or other time series function specifications.)

    Normalization

    With “normalization” we mean that the values of a given time series values are divided (normalized) with a descriptive statistic derived from a specified set of values. The specified set of values is given with the parameter “NormalizationScope” in computation specification.
    At the normalization stage each time series is associated with an entity ID and variable.
    Normalization is done at three different scopes: “entity”, “attribute”, and “variable”.
    ◼
  • Normalization with scope attribute means that
  • ◼
  • next we find all entity ID's that are associated with the same attribute value,
  • Note that the scope “entity” is the most granular, and the scope “variable” is the coarsest.
    Here are the normalization values that should be used when normalizing “unseen data.”

    Making contingency matrices

    One of the main goals of ERTMon is to produce contingency matrices corresponding to the event records data.
    The contingency matrices are created and stored as SSparseMatrix objects, [AAp7].
    We can obtain an association of the contingency matrices for each variable-and-aggregation-function pair, or obtain the overall contingency matrix.
    References

    Paclets

    [AAp1] Anton Antonov, DataReshapers, (2023), Wolfram Language Paclet Repository.
    [AAp2] Anton Antonov, MonadMakers, (2023), Wolfram Language Paclet Repository.
    [AAp3] Anton Antonov, OutlierIdentifiers, (2023), Wolfram Language Paclet Repository.
    [AAp4] Anton Antonov, SSparseMatrix, (2023), Wolfram Language Paclet Repository.

    Documents

    © 2025 Wolfram. All rights reserved.

    • Legal & Privacy Policy
    • Contact Us
    • WolframAlpha.com
    • WolframCloud.com