Wolfram Language
Paclet Repository
Community-contributed installable additions to the Wolfram Language
Primary Navigation
Categories
Cloud & Deployment
Core Language & Structure
Data Manipulation & Analysis
Engineering Data & Computation
External Interfaces & Connections
Financial Data & Computation
Geographic Data & Computation
Geometry
Graphs & Networks
Higher Mathematical Computation
Images
Knowledge Representation & Natural Language
Machine Learning
Notebook Documents & Presentation
Scientific and Medical Data & Computation
Social, Cultural & Linguistic Data
Strings & Text
Symbolic & Numeric Computation
System Operation & Setup
Time-Related Computation
User Interface Construction
Visualization & Graphics
Random Paclet
Alphabetical List
Using Paclets
Create a Paclet
Get Started
Download Definition Notebook
Learn More about
Wolfram Language
EpidemiologicalModeling
Guides
Epidemiological modeling
Tech Notes
SEI2HR-Econ model with quarantine and supplies scenarios
SEI2HR model with quarantine scenarios
Symbols
AddModelIdentifier
AddTermsToEquations
AggregateForCellIDs
ApproximateField
AssignInitialConditions
AssignRateRules
CoerceAnnotatedSymbols
ConvertSolutions
EconomicsStockPlots
EpidemiologicalFullModelQ
EpidemiologicalModelQ
EpidemiologyFullModelQ
EpidemiologyModelQ
EquationPosition
EvaluateSolutionsByModelIDs
EvaluateSolutionsOverGraph
EvaluateSolutionsOverGraphVertexes
GetPopulations
GetPopulationSymbols
GetRates
GetRateSymbols
GetStocks
GetStockSymbols
GridObjectQ
JoinModels
MakeAgeGroupMixingTerms
MakeAgeGroupMortalityTerms
MakeCoreMultiSiteModel
MakeHexagonGrid
MakeMigrationTerms
MakePolygonGrid
MakeVertexShapeFunction
MalariaModel
ModelGridTableForm
ModelNDSolveEquations
ModelNDSolve
MultiSiteModelStocksPlot
PopulationStockPlots
PrefixGroupsSolutionsListPlot
SEI2HREconModel
SEI2HRModel
SEI2RModel
SEI4RModel
SEIRModel
SetInitialConditions
SetRateRules
SI2RModel
SIRModel
SiteIndexSolutionsPlot
ToAssociation
ToGraph
ToPrefixGroupsSolutions
ToSiteCompartmentsModel
ToTimeSeries
AntonAntonov`EpidemiologicalModeling`
M
a
l
a
r
i
a
M
o
d
e
l
M
a
l
a
r
i
a
M
o
d
e
l
[
v
a
r
,
c
o
n
]
g
e
n
e
r
a
t
e
s
m
a
l
a
r
i
a
m
o
d
e
l
s
t
o
c
k
s
,
r
a
t
e
s
,
a
n
d
e
q
u
a
t
i
o
n
s
u
s
i
n
g
t
h
e
t
i
m
e
v
a
r
i
a
b
l
e
v
a
r
w
i
t
h
s
y
m
b
o
l
s
i
n
t
h
e
c
o
n
t
e
x
t
c
o
n
.
Examples
(
1
)
Basic Examples
(
1
)
Make a Malaria model:
I
n
[
1
]
:
=
m
=
M
a
l
a
r
i
a
M
o
d
e
l
[
t
,
"
I
n
i
t
i
a
l
C
o
n
d
i
t
i
o
n
s
"
T
r
u
e
,
"
R
a
t
e
R
u
l
e
s
"
T
r
u
e
,
"
R
o
s
s
"
F
a
l
s
e
]
;
Tabulate the model:
I
n
[
2
]
:
=
M
o
d
e
l
G
r
i
d
T
a
b
l
e
F
o
r
m
[
m
]
O
u
t
[
2
]
=
S
t
o
c
k
s
#
S
y
m
b
o
l
D
e
s
c
r
i
p
t
i
o
n
1
H
P
[
t
]
H
u
m
a
n
P
o
p
u
l
a
t
i
o
n
2
M
P
[
t
]
M
o
s
q
u
i
t
o
P
o
p
u
l
a
t
i
o
n
3
S
H
P
[
t
]
S
u
s
c
e
p
t
i
b
l
e
H
u
m
a
n
P
o
p
u
l
a
t
i
o
n
4
S
M
P
[
t
]
S
u
s
c
e
p
t
i
b
l
e
M
o
s
q
u
i
t
o
P
o
p
u
l
a
t
i
o
n
5
I
H
P
[
t
]
I
n
f
e
c
t
e
d
H
u
m
a
n
P
o
p
u
l
a
t
i
o
n
6
I
M
P
[
t
]
I
n
f
e
c
t
e
d
M
o
s
q
u
i
t
o
P
o
p
u
l
a
t
i
o
n
,
R
a
t
e
s
#
S
y
m
b
o
l
D
e
s
c
r
i
p
t
i
o
n
1
a
N
u
m
b
e
r
o
f
b
i
t
e
s
p
e
r
m
o
s
q
u
i
t
o
a
n
d
t
i
m
e
u
n
i
t
2
b
P
r
o
b
a
b
i
l
i
t
y
t
h
a
t
a
b
i
t
e
g
e
n
e
r
a
t
e
s
a
h
u
m
a
n
i
n
f
e
c
t
i
o
n
3
c
P
r
o
b
a
b
i
l
i
t
y
t
h
a
t
a
m
o
s
q
u
i
t
o
b
e
c
o
m
e
s
i
n
f
e
c
t
e
d
4
a
i
p
A
v
e
r
a
g
e
h
u
m
a
n
i
n
f
e
c
t
i
o
u
s
p
e
r
i
o
d
5
m
l
s
M
o
s
q
u
i
t
o
l
i
f
e
s
p
a
n
,
E
q
u
a
t
i
o
n
s
#
E
q
u
a
t
i
o
n
1
′
S
H
P
[
t
]
-
a
b
(
H
P
[
0
]
-
I
H
P
[
t
]
)
I
M
P
[
t
]
H
P
[
0
]
2
′
I
H
P
[
t
]
-
I
H
P
[
t
]
a
i
p
+
a
b
(
H
P
[
0
]
-
I
H
P
[
t
]
)
I
M
P
[
t
]
H
P
[
0
]
3
′
S
M
P
[
t
]
-
a
c
I
H
P
[
t
]
(
M
P
[
0
]
-
I
M
P
[
t
]
)
M
P
[
0
]
4
′
I
M
P
[
t
]
a
c
I
H
P
[
t
]
(
M
P
[
0
]
-
I
M
P
[
t
]
)
M
P
[
0
]
-
I
M
P
[
t
]
m
l
s
,
R
a
t
e
R
u
l
e
s
#
S
y
m
b
o
l
V
a
l
u
e
1
H
P
[
0
]
1
0
0
0
0
0
2
M
P
[
0
]
1
0
0
0
0
0
0
3
a
0
.
5
4
b
0
.
3
5
5
c
0
.
5
6
a
i
p
2
0
7
m
l
s
2
0
,
I
n
i
t
i
a
l
C
o
n
d
i
t
i
o
n
s
#
E
q
u
a
t
i
o
n
1
S
H
P
[
0
]
9
9
9
9
9
2
I
H
P
[
0
]
1
3
S
M
P
[
0
]
9
9
9
9
9
9
4
I
M
P
[
0
]
1
Here are model's equations:
I
n
[
3
]
:
=
M
o
d
e
l
N
D
S
o
l
v
e
E
q
u
a
t
i
o
n
s
[
m
]
O
u
t
[
3
]
=
′
S
H
P
[
t
]
-
1
.
7
5
×
-
6
1
0
(
1
0
0
0
0
0
-
I
H
P
[
t
]
)
I
M
P
[
t
]
,
′
I
H
P
[
t
]
-
I
H
P
[
t
]
2
0
+
1
.
7
5
×
-
6
1
0
(
1
0
0
0
0
0
-
I
H
P
[
t
]
)
I
M
P
[
t
]
,
′
S
M
P
[
t
]
-
2
.
5
×
-
7
1
0
I
H
P
[
t
]
(
1
0
0
0
0
0
0
-
I
M
P
[
t
]
)
,
′
I
M
P
[
t
]
2
.
5
×
-
7
1
0
I
H
P
[
t
]
(
1
0
0
0
0
0
0
-
I
M
P
[
t
]
)
-
I
M
P
[
t
]
2
0
,
S
H
P
[
0
]
9
9
9
9
9
,
I
H
P
[
0
]
1
,
S
M
P
[
0
]
9
9
9
9
9
9
,
I
M
P
[
0
]
1
Simulate the model for 20 days:
I
n
[
4
]
:
=
a
S
o
l
=
A
s
s
o
c
i
a
t
i
o
n
@
F
i
r
s
t
@
M
o
d
e
l
N
D
S
o
l
v
e
[
m
,
{
t
,
0
,
2
0
}
]
O
u
t
[
4
]
=
H
P
H
P
,
M
P
M
P
,
S
H
P
I
n
t
e
r
p
o
l
a
t
i
n
g
F
u
n
c
t
i
o
n
D
o
m
a
i
n
:
{
{
0
.
,
2
0
.
}
}
O
u
t
p
u
t
:
s
c
a
l
a
r
,
S
M
P
I
n
t
e
r
p
o
l
a
t
i
n
g
F
u
n
c
t
i
o
n
D
o
m
a
i
n
:
{
{
0
.
,
2
0
.
}
}
O
u
t
p
u
t
:
s
c
a
l
a
r
,
I
H
P
I
n
t
e
r
p
o
l
a
t
i
n
g
F
u
n
c
t
i
o
n
D
o
m
a
i
n
:
{
{
0
.
,
2
0
.
}
}
O
u
t
p
u
t
:
s
c
a
l
a
r
,
I
M
P
I
n
t
e
r
p
o
l
a
t
i
n
g
F
u
n
c
t
i
o
n
D
o
m
a
i
n
:
{
{
0
.
,
2
0
.
}
}
O
u
t
p
u
t
:
s
c
a
l
a
r
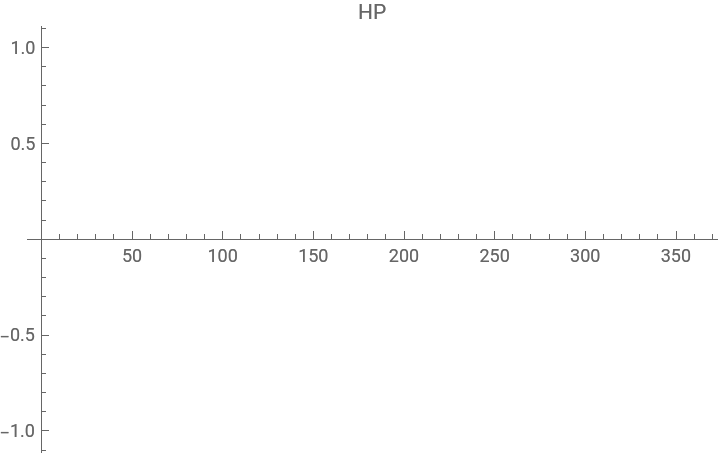
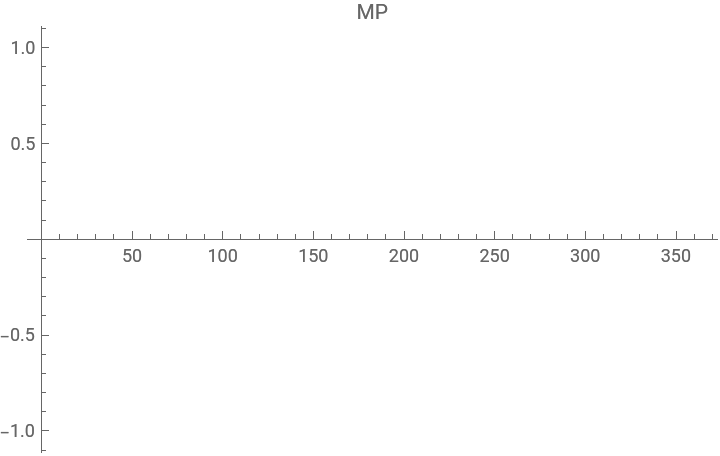
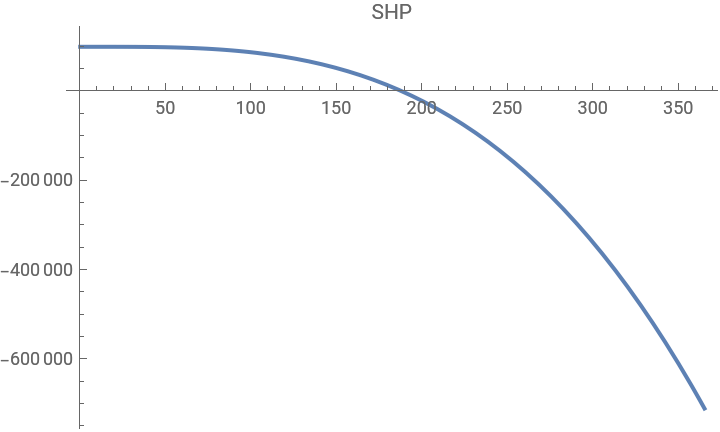
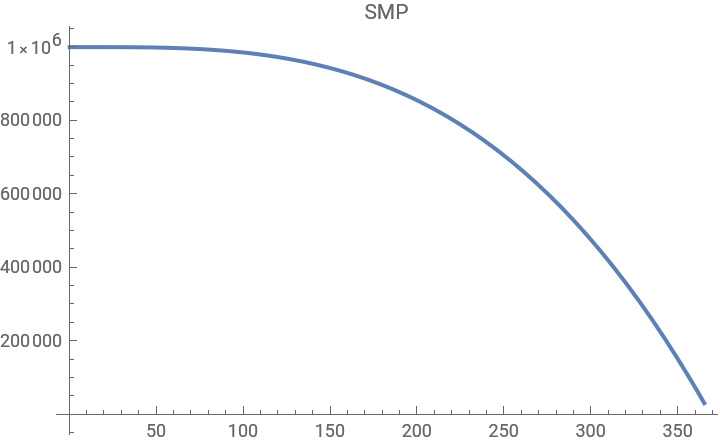
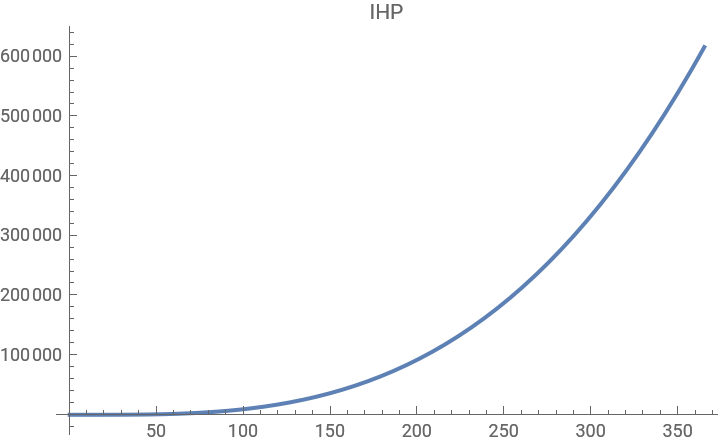
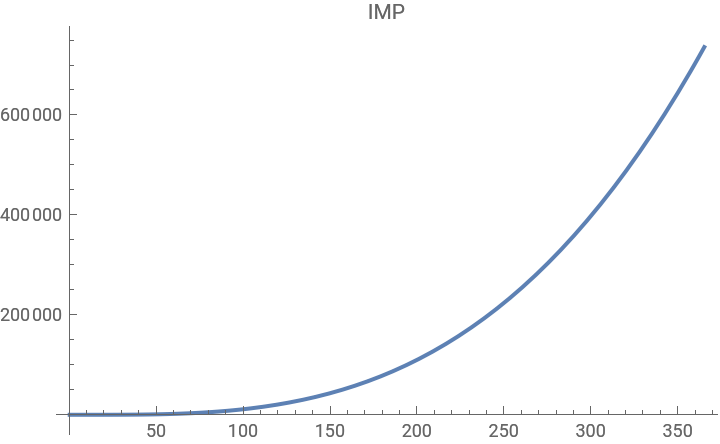
Plot the solutions:
I
n
[
5
]
:
=
A
s
s
o
c
i
a
t
i
o
n
@
K
e
y
V
a
l
u
e
M
a
p
[
#
1
P
l
o
t
[
E
v
a
l
u
a
t
e
[
#
2
[
t
]
]
,
{
t
,
0
,
3
6
5
}
,
P
l
o
t
L
a
b
e
l
#
1
]
&
,
a
S
o
l
]
O
u
t
[
5
]
=
H
P
,
M
P
,
S
H
P
,
S
M
P
,
I
H
P
,
I
M
P
S
e
e
A
l
s
o
"
X
X
X
X
"
R
e
l
a
t
e
d
G
u
i
d
e
s
▪
E
p
i
d
e
m
i
o
l
o
g
i
c
a
l
m
o
d
e
l
i
n
g
"
"