Wolfram Language Paclet Repository
Community-contributed installable additions to the Wolfram Language
Determine fission-fusion dynamics from position data
Contributed by: Katja Della Libera
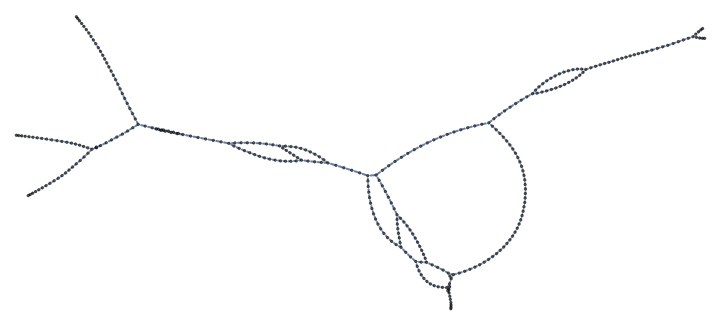
Paclet publishing the "sticky" DBSCAN-modification used in the animal behaviour paper "Rate of fission-fusion events in domestic sheep is linked to time of day but not resource distribution". The first function "StickyDBSCAN" allows a user to assign groups based on GPS (or other coordinate) data for a number of individuals and time steps. The second function "FindFissionFusionGraph" takes the output of DBSCAN and turns it into a graph that associates groups with overlapping membership if they exist in consecutive time steps.

To install this paclet in your Wolfram Language environment,
evaluate this code:
PacletInstall["KatjaDellaLibera/StickyDBSCAN"]
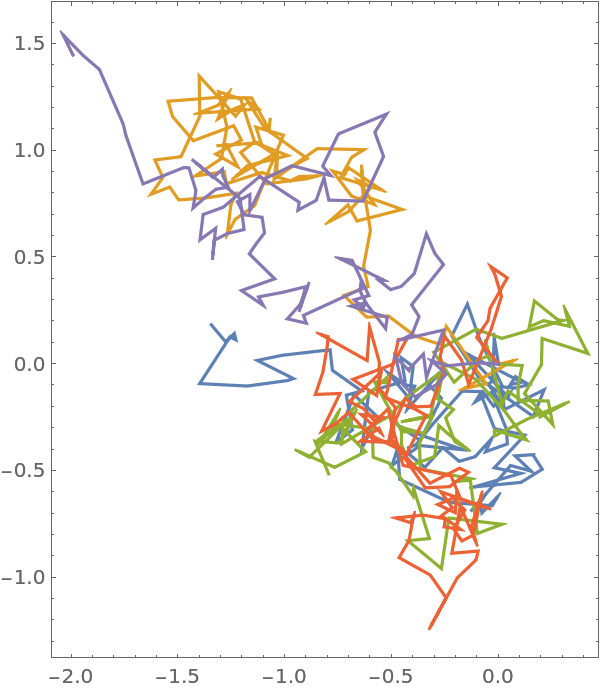
Sample 5 Brownian Motion paths. We will use this as mock GPS data for 5 individuals:
| In[1]:= |
Visualize the Paths:
| In[2]:= |
| Out[2]= |  |
Make a list of all the pairs:
| In[3]:= |
| Out[3]= |
For each of these pairs find the distance at every time step:
| In[4]:= | ![allBrownianPairData = Map[Table[
EuclideanDistance[samples[[#[[1]], t]], samples[[#[[2]], t]]], {t, 1, Length[samples[[1]]]}] &, allBrownianPairs, {2}];](https://www.wolframcloud.com/obj/resourcesystem/images/3af/3af535d0-222b-482e-b08f-d4ddc44d6da3/4f5c785b584b337f.png) |
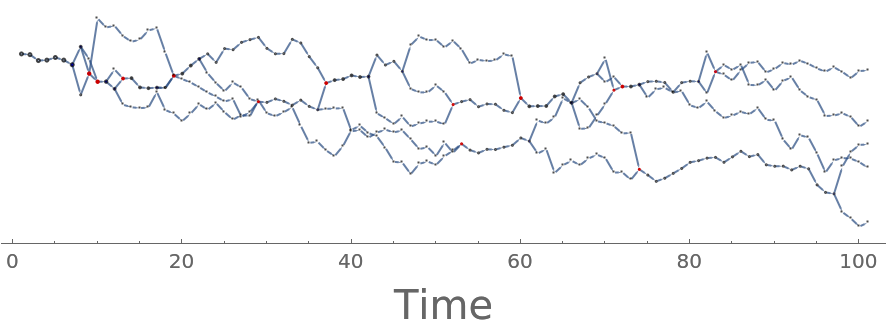
Use the stickyDBSCAN function to find the groups at each time step. Let's try an inner radius of 0.3 and an outer radius of 0.5. the tmin is 1 to start from the beginning and the tmax is the number of fake GPS data points:
| In[5]:= |
| In[6]:= |
| Out[6]= |  |
We can make the graph look nicer by putting time on the x-axis:
| In[7]:= | ![With[{g = ffGraph},
HighlightGraph[Graph[g,
VertexSize -> (# -> Length[First[#]]*10 & /@ VertexList[g]),
VertexCoordinates -> (# -> {Last[#], 10*Mean[DeleteMissing[samples[[#[[1]], Last[#], 1]]]]} & /@ VertexList[g]), Frame -> {{False, False}, {True, False}}, FrameLabel -> Style["Time", 20], FrameTicks -> Automatic],
{Select[VertexList[g], VertexInDegree[g, #] >= 2 &], Style[Select[VertexList[g], VertexOutDegree[g, #] >= 2 &], Blue]}]]](https://www.wolframcloud.com/obj/resourcesystem/images/3af/3af535d0-222b-482e-b08f-d4ddc44d6da3/2180cde36be28190.png) |
| Out[7]= |  |
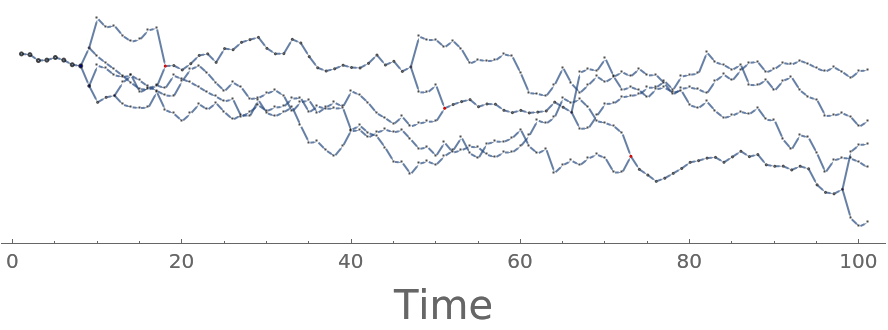
We can try out a different combination of radii to see fewer fission-fusion events:
| In[8]:= |
| In[9]:= |
| In[10]:= | ![With[{g = ffGraph2},
HighlightGraph[Graph[g,
VertexSize -> (# -> Length[First[#]]*5 & /@ VertexList[g]),
VertexCoordinates -> (# -> {Last[#], 10*Mean[DeleteMissing[samples[[#[[1]], Last[#], 1]]]]} & /@ VertexList[g]), Frame -> {{False, False}, {True, False}}, FrameLabel -> Style["Time", 20], FrameTicks -> Automatic],
{Select[VertexList[g], VertexInDegree[g, #] >= 2 &], Style[Select[VertexList[g], VertexOutDegree[g, #] >= 2 &], Blue]}]]](https://www.wolframcloud.com/obj/resourcesystem/images/3af/3af535d0-222b-482e-b08f-d4ddc44d6da3/4a268aa3526baa2d.png) |
| Out[10]= |  |
Wolfram Language Version 13.2