Details
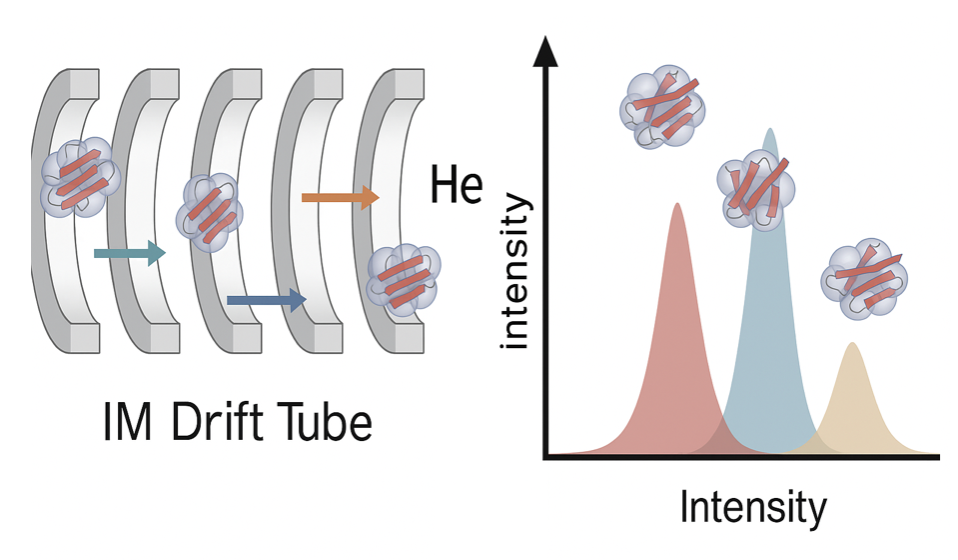
Read and Smooth ATDs
Supports .Mcs and .csv file formats using mcsreadatd and
SmoothKernelDistribution, creating smoothed probability density functions from raw IM-MS data.
Peak Fitting Based on Known Monomer CCS
Calculates theoretical arrival times of oligomers using a custom function IsoDriftTime, given parameters such as: Monomer CCS, Molecular weight,Charge,Drift voltage, pressure, temperature, and tube length
Arrival Time Prediction & Visualization
-Plots predicted oligomer arrival times overlaid on experimental ATDs.
-Labels peaks corresponding to specific oligomer orders (e.g., monomer, dimer, trimer).
-Computes FWHM (full width at half max) of arrival time peaks, scaled by oligomer size.
Mobility Transformation & Plotting
-Converts arrival times to inverse ion mobility (1/K₀) using InverseIonMobilityGraph
-Plots ATDs in both time and mobility space with custom styling and color coding for different oligomers.
![atd = SmoothKernelDistribution[InterpretationBox[FrameBox[TagBox[TooltipBox[PaneBox[GridBox[List[List[GraphicsBox[List[Thickness[0.0025`], List[FaceForm[List[RGBColor[0.9607843137254902`, 0.5058823529411764`, 0.19607843137254902`], Opacity[1.`]]], FilledCurveBox[List[List[List[0, 2, 0], List[0, 1, 0], List[0, 1, 0], List[0, 1, 0], List[0, 1, 0]], List[List[0, 2, 0], List[0, 1, 0], List[0, 1, 0], List[0, 1, 0], List[0, 1, 0]], List[List[0, 2, 0], List[0, 1, 0], List[0, 1, 0], List[0, 1, 0], List[0, 1, 0], List[0, 1, 0]], List[List[0, 2, 0], List[1, 3, 3], List[0, 1, 0], List[1, 3, 3], List[0, 1, 0], List[1, 3, 3], List[0, 1, 0], List[1, 3, 3], List[1, 3, 3], List[0, 1, 0], List[1, 3, 3], List[0, 1, 0], List[1, 3, 3]]], List[List[List[205.`, 22.863691329956055`], List[205.`, 212.31669425964355`], List[246.01799774169922`, 235.99870109558105`], List[369.0710144042969`, 307.0436840057373`], List[369.0710144042969`, 117.59068870544434`], List[205.`, 22.863691329956055`]], List[List[30.928985595703125`, 307.0436840057373`], List[153.98200225830078`, 235.99870109558105`], List[195.`, 212.31669425964355`], List[195.`, 22.863691329956055`], List[30.928985595703125`, 117.59068870544434`], List[30.928985595703125`, 307.0436840057373`]], List[List[200.`, 410.42970085144043`], List[364.0710144042969`, 315.7036876678467`], List[241.01799774169922`, 244.65868949890137`], List[200.`, 220.97669792175293`], List[158.98200225830078`, 244.65868949890137`], List[35.928985595703125`, 315.7036876678467`], List[200.`, 410.42970085144043`]], List[List[376.5710144042969`, 320.03370475769043`], List[202.5`, 420.53370475769043`], List[200.95300006866455`, 421.42667961120605`], List[199.04699993133545`, 421.42667961120605`], List[197.5`, 420.53370475769043`], List[23.428985595703125`, 320.03370475769043`], List[21.882003784179688`, 319.1406993865967`], List[20.928985595703125`, 317.4896984100342`], List[20.928985595703125`, 315.7036876678467`], List[20.928985595703125`, 114.70369529724121`], List[20.928985595703125`, 112.91769218444824`], List[21.882003784179688`, 111.26669120788574`], List[23.428985595703125`, 110.37369346618652`], List[197.5`, 9.87369155883789`], List[198.27300024032593`, 9.426692008972168`], List[199.13700008392334`, 9.203690528869629`], List[200.`, 9.203690528869629`], List[200.86299991607666`, 9.203690528869629`], List[201.72699999809265`, 9.426692008972168`], List[202.5`, 9.87369155883789`], List[376.5710144042969`, 110.37369346618652`], List[378.1179962158203`, 111.26669120788574`], List[379.0710144042969`, 112.91769218444824`], List[379.0710144042969`, 114.70369529724121`], List[379.0710144042969`, 315.7036876678467`], List[379.0710144042969`, 317.4896984100342`], List[378.1179962158203`, 319.1406993865967`], List[376.5710144042969`, 320.03370475769043`]]]]], List[FaceForm[List[RGBColor[0.5529411764705883`, 0.6745098039215687`, 0.8117647058823529`], Opacity[1.`]]], FilledCurveBox[List[List[List[0, 2, 0], List[0, 1, 0], List[0, 1, 0], List[0, 1, 0]]], List[List[List[44.92900085449219`, 282.59088134765625`], List[181.00001525878906`, 204.0298843383789`], List[181.00001525878906`, 46.90887451171875`], List[44.92900085449219`, 125.46986389160156`], List[44.92900085449219`, 282.59088134765625`]]]]], List[FaceForm[List[RGBColor[0.6627450980392157`, 0.803921568627451`, 0.5686274509803921`], Opacity[1.`]]], FilledCurveBox[List[List[List[0, 2, 0], List[0, 1, 0], List[0, 1, 0], List[0, 1, 0]]], List[List[List[355.0710144042969`, 282.59088134765625`], List[355.0710144042969`, 125.46986389160156`], List[219.`, 46.90887451171875`], List[219.`, 204.0298843383789`], List[355.0710144042969`, 282.59088134765625`]]]]], List[FaceForm[List[RGBColor[0.6901960784313725`, 0.5882352941176471`, 0.8117647058823529`], Opacity[1.`]]], FilledCurveBox[List[List[List[0, 2, 0], List[0, 1, 0], List[0, 1, 0], List[0, 1, 0]]], List[List[List[200.`, 394.0606994628906`], List[336.0710144042969`, 315.4997024536133`], List[200.`, 236.93968200683594`], List[63.928985595703125`, 315.4997024536133`], List[200.`, 394.0606994628906`]]]]]], List[Rule[BaselinePosition, Scaled[0.15`]], Rule[ImageSize, 10], Rule[ImageSize, 15]]], StyleBox[RowBox[List["mIonCount", " "]], Rule[ShowAutoStyles, False], Rule[ShowStringCharacters, False], Rule[FontSize, Times[0.9`, Inherited]], Rule[FontColor, GrayLevel[0.1`]]]]], Rule[GridBoxSpacings, List[Rule["Columns", List[List[0.25`]]]]]], Rule[Alignment, List[Left, Baseline]], Rule[BaselinePosition, Baseline], Rule[FrameMargins, List[List[3, 0], List[0, 0]]], Rule[BaseStyle, List[Rule[LineSpacing, List[0, 0]], Rule[LineBreakWithin, False]]]], RowBox[List["PacletSymbol", "[", RowBox[List["\"YingyingJin/IMMSATD\"", ",", "\"YingyingJin`IMMSATD`mIonCount\""]], "]"]], Rule[TooltipStyle, List[Rule[ShowAutoStyles, True], Rule[ShowStringCharacters, True]]]], Function[Annotation[Slot[1], Style[Defer[PacletSymbol["YingyingJin/IMMSATD", "YingyingJin`IMMSATD`mIonCount"]], Rule[ShowStringCharacters, True]], "Tooltip"]]], Rule[Background, RGBColor[0.968`, 0.976`, 0.984`]], Rule[BaselinePosition, Baseline], Rule[DefaultBaseStyle, List[]], Rule[FrameMargins, List[List[0, 0], List[1, 1]]], Rule[FrameStyle, RGBColor[0.831`, 0.847`, 0.85`]], Rule[RoundingRadius, 4]], PacletSymbol["YingyingJin/IMMSATD", "YingyingJin`IMMSATD`mIonCount"], Rule[Selectable, False], Rule[SelectWithContents, True], Rule[BoxID, "PacletSymbolBox"]][
mcsreadatd[
BinaryReadList[
"/Users/yingyingjin/Box Sync/ESI_2023/120123/A315T_5uM/a1332a.Mcs"]]], 1.5]](https://www.wolframcloud.com/obj/resourcesystem/images/627/627f4176-7bf6-402b-8894-0cc64c03d497/3d007aa27d4f8cf6.png)
![atdplot = Plot[PDF[atd, x], {x, 400, 1000}, Frame -> True, FrameStyle -> Black,
PlotRange -> {0, 0.02}, FrameStyle -> Black, AspectRatio -> 1, PlotStyle -> {Black, Thick}, PlotRange -> All, ImageSize -> Small]](https://www.wolframcloud.com/obj/resourcesystem/images/627/627f4176-7bf6-402b-8894-0cc64c03d497/45f0f1eb901255ce.png)

![Atd1 = IsoDriftTime[{280, 1332, 1}, n -> #, T -> 303.5(*Kelvin*), P -> 5(*torr*), dV -> 90.2, t0 -> 240] & /@ nmer
Atd = Atd1;](https://www.wolframcloud.com/obj/resourcesystem/images/627/627f4176-7bf6-402b-8894-0cc64c03d497/4374437873582e51.png)
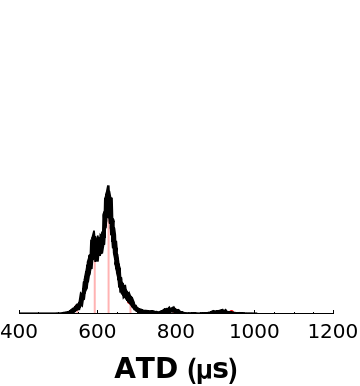
![ShowATD = Show[ListPlot[{Atd[[#]], PDF[atd, Atd[[#]]]} & /@ Range[Length[Atd]],
Filling -> Axis, PlotStyle -> {Red, FontSize -> 30}, PlotRange -> {{400, 1200}, {0, 0.04}}, Frame -> {{False, False}, {True, False}}, FrameStyle -> Black, AspectRatio -> 1, FrameLabel -> {Style["ATD (µs)", FontSize -> 14, Bold]}, ImageSize -> Small], atdplot]](https://www.wolframcloud.com/obj/resourcesystem/images/627/627f4176-7bf6-402b-8894-0cc64c03d497/173619ee053db1e2.png)
![mercolor = {{RGBColor[0.8, 0.31, 0.31], Dashing[{Small, Small}]}, {RGBColor[0.5, 0.69, 0.74], Dashing[{Small, Small}]}, {RGBColor[1, 0.5, 0], Dashing[{Small, Small}]}, {RGBColor[1., 0.85, 0.49], Dashing[{Small, Small}]}, {RGBColor[0.5, 0, 0.5], Dashing[{Small, Small}]}, {RGBColor[0.66, 0.71, 0.5], Dashing[{Small, Small}]}, {RGBColor[1, 0.5, 0.5], Dashing[{Small, Small}]}};](https://www.wolframcloud.com/obj/resourcesystem/images/627/627f4176-7bf6-402b-8894-0cc64c03d497/3b7c2aeeb379673f.png)
![mobilitygraph = ListLinePlot[
Table[{InterpretationBox[FrameBox[TagBox[TooltipBox[PaneBox[GridBox[List[List[GraphicsBox[List[Thickness[0.0025`], List[FaceForm[List[RGBColor[0.9607843137254902`, 0.5058823529411764`, 0.19607843137254902`], Opacity[1.`]]], FilledCurveBox[List[List[List[0, 2, 0], List[0, 1, 0], List[0, 1, 0], List[0, 1, 0], List[0, 1, 0]], List[List[0, 2, 0], List[0, 1, 0], List[0, 1, 0], List[0, 1, 0], List[0, 1, 0]], List[List[0, 2, 0], List[0, 1, 0], List[0, 1, 0], List[0, 1, 0], List[0, 1, 0], List[0, 1, 0]], List[List[0, 2, 0], List[1, 3, 3], List[0, 1, 0], List[1, 3, 3], List[0, 1, 0], List[1, 3, 3], List[0, 1, 0], List[1, 3, 3], List[1, 3, 3], List[0, 1, 0], List[1, 3, 3], List[0, 1, 0], List[1, 3, 3]]], List[List[List[205.`, 22.863691329956055`], List[205.`, 212.31669425964355`], List[246.01799774169922`, 235.99870109558105`], List[369.0710144042969`, 307.0436840057373`], List[369.0710144042969`, 117.59068870544434`], List[205.`, 22.863691329956055`]], List[List[30.928985595703125`, 307.0436840057373`], List[153.98200225830078`, 235.99870109558105`], List[195.`, 212.31669425964355`], List[195.`, 22.863691329956055`], List[30.928985595703125`, 117.59068870544434`], List[30.928985595703125`, 307.0436840057373`]], List[List[200.`, 410.42970085144043`], List[364.0710144042969`, 315.7036876678467`], List[241.01799774169922`, 244.65868949890137`], List[200.`, 220.97669792175293`], List[158.98200225830078`, 244.65868949890137`], List[35.928985595703125`, 315.7036876678467`], List[200.`, 410.42970085144043`]], List[List[376.5710144042969`, 320.03370475769043`], List[202.5`, 420.53370475769043`], List[200.95300006866455`, 421.42667961120605`], List[199.04699993133545`, 421.42667961120605`], List[197.5`, 420.53370475769043`], List[23.428985595703125`, 320.03370475769043`], List[21.882003784179688`, 319.1406993865967`], List[20.928985595703125`, 317.4896984100342`], List[20.928985595703125`, 315.7036876678467`], List[20.928985595703125`, 114.70369529724121`], List[20.928985595703125`, 112.91769218444824`], List[21.882003784179688`, 111.26669120788574`], List[23.428985595703125`, 110.37369346618652`], List[197.5`, 9.87369155883789`], List[198.27300024032593`, 9.426692008972168`], List[199.13700008392334`, 9.203690528869629`], List[200.`, 9.203690528869629`], List[200.86299991607666`, 9.203690528869629`], List[201.72699999809265`, 9.426692008972168`], List[202.5`, 9.87369155883789`], List[376.5710144042969`, 110.37369346618652`], List[378.1179962158203`, 111.26669120788574`], List[379.0710144042969`, 112.91769218444824`], List[379.0710144042969`, 114.70369529724121`], List[379.0710144042969`, 315.7036876678467`], List[379.0710144042969`, 317.4896984100342`], List[378.1179962158203`, 319.1406993865967`], List[376.5710144042969`, 320.03370475769043`]]]]], List[FaceForm[List[RGBColor[0.5529411764705883`, 0.6745098039215687`, 0.8117647058823529`], Opacity[1.`]]], FilledCurveBox[List[List[List[0, 2, 0], List[0, 1, 0], List[0, 1, 0], List[0, 1, 0]]], List[List[List[44.92900085449219`, 282.59088134765625`], List[181.00001525878906`, 204.0298843383789`], List[181.00001525878906`, 46.90887451171875`], List[44.92900085449219`, 125.46986389160156`], List[44.92900085449219`, 282.59088134765625`]]]]], List[FaceForm[List[RGBColor[0.6627450980392157`, 0.803921568627451`, 0.5686274509803921`], Opacity[1.`]]], FilledCurveBox[List[List[List[0, 2, 0], List[0, 1, 0], List[0, 1, 0], List[0, 1, 0]]], List[List[List[355.0710144042969`, 282.59088134765625`], List[355.0710144042969`, 125.46986389160156`], List[219.`, 46.90887451171875`], List[219.`, 204.0298843383789`], List[355.0710144042969`, 282.59088134765625`]]]]], List[FaceForm[List[RGBColor[0.6901960784313725`, 0.5882352941176471`, 0.8117647058823529`], Opacity[1.`]]], FilledCurveBox[List[List[List[0, 2, 0], List[0, 1, 0], List[0, 1, 0], List[0, 1, 0]]], List[List[List[200.`, 394.0606994628906`], List[336.0710144042969`, 315.4997024536133`], List[200.`, 236.93968200683594`], List[63.928985595703125`, 315.4997024536133`], List[200.`, 394.0606994628906`]]]]]], List[Rule[BaselinePosition, Scaled[0.15`]], Rule[ImageSize, 10], Rule[ImageSize, 15]]], StyleBox[RowBox[List["InverseIonMobilityGraph", " "]], Rule[ShowAutoStyles, False], Rule[ShowStringCharacters, False], Rule[FontSize, Times[0.9`, Inherited]], Rule[FontColor, GrayLevel[0.1`]]]]], Rule[GridBoxSpacings, List[Rule["Columns", List[List[0.25`]]]]]], Rule[Alignment, List[Left, Baseline]], Rule[BaselinePosition, Baseline], Rule[FrameMargins, List[List[3, 0], List[0, 0]]], Rule[BaseStyle, List[Rule[LineSpacing, List[0, 0]], Rule[LineBreakWithin, False]]]], RowBox[List["PacletSymbol", "[", RowBox[List["\"YingyingJin/IMMSATD\"", ",", "\"YingyingJin`IMMSATD`InverseIonMobilityGraph\""]], "]"]], Rule[TooltipStyle, List[Rule[ShowAutoStyles, True], Rule[ShowStringCharacters, True]]]], Function[Annotation[Slot[1], Style[Defer[PacletSymbol["YingyingJin/IMMSATD", "YingyingJin`IMMSATD`InverseIonMobilityGraph"]], Rule[ShowStringCharacters, True]], "Tooltip"]]], Rule[Background, RGBColor[0.968`, 0.976`, 0.984`]], Rule[BaselinePosition, Baseline], Rule[DefaultBaseStyle, List[]], Rule[FrameMargins, List[List[0, 0], List[1, 1]]], Rule[FrameStyle, RGBColor[0.831`, 0.847`, 0.85`]], Rule[RoundingRadius, 4]], PacletSymbol["YingyingJin/IMMSATD", "YingyingJin`IMMSATD`InverseIonMobilityGraph"], Rule[Selectable, False], Rule[SelectWithContents, True], Rule[BoxID, "PacletSymbolBox"]][x, dV -> 90.2, t0 -> 240], PDF[atd, x]}, {x, 300, 1200}], PlotRange -> {{0.1, 0.6}, {0, 0.03}}, Axes -> {True, False}, AspectRatio -> 1, PlotStyle -> {Black, Thick}, ImageSize -> Small, Frame -> True, FrameStyle -> Black, AspectRatio -> 1, FrameLabel -> {Style[
"1/\!\(\*SubscriptBox[\(K\), \(0\)]\) (\!\(\*FractionBox[\(Vs\), SuperscriptBox[\(cm\), \(2\)]]\))", FontSize -> 14, Bold]}]](https://www.wolframcloud.com/obj/resourcesystem/images/627/627f4176-7bf6-402b-8894-0cc64c03d497/046ac733dac79cdf.png)

![ss = (FWHM[{Atd[[#]], 1}]*(nmer[[#]])^0.5)/5000 & /@ Range[1, Length[nmer]]
NpeakMobility = {InterpretationBox[FrameBox[TagBox[TooltipBox[PaneBox[GridBox[List[List[GraphicsBox[List[Thickness[0.0025`], List[FaceForm[List[RGBColor[0.9607843137254902`, 0.5058823529411764`, 0.19607843137254902`], Opacity[1.`]]], FilledCurveBox[List[List[List[0, 2, 0], List[0, 1, 0], List[0, 1, 0], List[0, 1, 0], List[0, 1, 0]], List[List[0, 2, 0], List[0, 1, 0], List[0, 1, 0], List[0, 1, 0], List[0, 1, 0]], List[List[0, 2, 0], List[0, 1, 0], List[0, 1, 0], List[0, 1, 0], List[0, 1, 0], List[0, 1, 0]], List[List[0, 2, 0], List[1, 3, 3], List[0, 1, 0], List[1, 3, 3], List[0, 1, 0], List[1, 3, 3], List[0, 1, 0], List[1, 3, 3], List[1, 3, 3], List[0, 1, 0], List[1, 3, 3], List[0, 1, 0], List[1, 3, 3]]], List[List[List[205.`, 22.863691329956055`], List[205.`, 212.31669425964355`], List[246.01799774169922`, 235.99870109558105`], List[369.0710144042969`, 307.0436840057373`], List[369.0710144042969`, 117.59068870544434`], List[205.`, 22.863691329956055`]], List[List[30.928985595703125`, 307.0436840057373`], List[153.98200225830078`, 235.99870109558105`], List[195.`, 212.31669425964355`], List[195.`, 22.863691329956055`], List[30.928985595703125`, 117.59068870544434`], List[30.928985595703125`, 307.0436840057373`]], List[List[200.`, 410.42970085144043`], List[364.0710144042969`, 315.7036876678467`], List[241.01799774169922`, 244.65868949890137`], List[200.`, 220.97669792175293`], List[158.98200225830078`, 244.65868949890137`], List[35.928985595703125`, 315.7036876678467`], List[200.`, 410.42970085144043`]], List[List[376.5710144042969`, 320.03370475769043`], List[202.5`, 420.53370475769043`], List[200.95300006866455`, 421.42667961120605`], List[199.04699993133545`, 421.42667961120605`], List[197.5`, 420.53370475769043`], List[23.428985595703125`, 320.03370475769043`], List[21.882003784179688`, 319.1406993865967`], List[20.928985595703125`, 317.4896984100342`], List[20.928985595703125`, 315.7036876678467`], List[20.928985595703125`, 114.70369529724121`], List[20.928985595703125`, 112.91769218444824`], List[21.882003784179688`, 111.26669120788574`], List[23.428985595703125`, 110.37369346618652`], List[197.5`, 9.87369155883789`], List[198.27300024032593`, 9.426692008972168`], List[199.13700008392334`, 9.203690528869629`], List[200.`, 9.203690528869629`], List[200.86299991607666`, 9.203690528869629`], List[201.72699999809265`, 9.426692008972168`], List[202.5`, 9.87369155883789`], List[376.5710144042969`, 110.37369346618652`], List[378.1179962158203`, 111.26669120788574`], List[379.0710144042969`, 112.91769218444824`], List[379.0710144042969`, 114.70369529724121`], List[379.0710144042969`, 315.7036876678467`], List[379.0710144042969`, 317.4896984100342`], List[378.1179962158203`, 319.1406993865967`], List[376.5710144042969`, 320.03370475769043`]]]]], List[FaceForm[List[RGBColor[0.5529411764705883`, 0.6745098039215687`, 0.8117647058823529`], Opacity[1.`]]], FilledCurveBox[List[List[List[0, 2, 0], List[0, 1, 0], List[0, 1, 0], List[0, 1, 0]]], List[List[List[44.92900085449219`, 282.59088134765625`], List[181.00001525878906`, 204.0298843383789`], List[181.00001525878906`, 46.90887451171875`], List[44.92900085449219`, 125.46986389160156`], List[44.92900085449219`, 282.59088134765625`]]]]], List[FaceForm[List[RGBColor[0.6627450980392157`, 0.803921568627451`, 0.5686274509803921`], Opacity[1.`]]], FilledCurveBox[List[List[List[0, 2, 0], List[0, 1, 0], List[0, 1, 0], List[0, 1, 0]]], List[List[List[355.0710144042969`, 282.59088134765625`], List[355.0710144042969`, 125.46986389160156`], List[219.`, 46.90887451171875`], List[219.`, 204.0298843383789`], List[355.0710144042969`, 282.59088134765625`]]]]], List[FaceForm[List[RGBColor[0.6901960784313725`, 0.5882352941176471`, 0.8117647058823529`], Opacity[1.`]]], FilledCurveBox[List[List[List[0, 2, 0], List[0, 1, 0], List[0, 1, 0], List[0, 1, 0]]], List[List[List[200.`, 394.0606994628906`], List[336.0710144042969`, 315.4997024536133`], List[200.`, 236.93968200683594`], List[63.928985595703125`, 315.4997024536133`], List[200.`, 394.0606994628906`]]]]]], List[Rule[BaselinePosition, Scaled[0.15`]], Rule[ImageSize, 10], Rule[ImageSize, 15]]], StyleBox[RowBox[List["InverseIonMobilityGraph", " "]], Rule[ShowAutoStyles, False], Rule[ShowStringCharacters, False], Rule[FontSize, Times[0.9`, Inherited]], Rule[FontColor, GrayLevel[0.1`]]]]], Rule[GridBoxSpacings, List[Rule["Columns", List[List[0.25`]]]]]], Rule[Alignment, List[Left, Baseline]], Rule[BaselinePosition, Baseline], Rule[FrameMargins, List[List[3, 0], List[0, 0]]], Rule[BaseStyle, List[Rule[LineSpacing, List[0, 0]], Rule[LineBreakWithin, False]]]], RowBox[List["PacletSymbol", "[", RowBox[List["\"YingyingJin/IMMSATD\"", ",", "\"YingyingJin`IMMSATD`InverseIonMobilityGraph\""]], "]"]], Rule[TooltipStyle, List[Rule[ShowAutoStyles, True], Rule[ShowStringCharacters, True]]]], Function[Annotation[Slot[1], Style[Defer[PacletSymbol["YingyingJin/IMMSATD", "YingyingJin`IMMSATD`InverseIonMobilityGraph"]], Rule[ShowStringCharacters, True]], "Tooltip"]]], Rule[Background, RGBColor[0.968`, 0.976`, 0.984`]], Rule[BaselinePosition, Baseline], Rule[DefaultBaseStyle, List[]], Rule[FrameMargins, List[List[0, 0], List[1, 1]]], Rule[FrameStyle, RGBColor[0.831`, 0.847`, 0.85`]], Rule[RoundingRadius, 4]], PacletSymbol["YingyingJin/IMMSATD", "YingyingJin`IMMSATD`InverseIonMobilityGraph"], Rule[Selectable, False], Rule[SelectWithContents, True], Rule[BoxID, "PacletSymbolBox"]][Atd[[#]], t0 -> 240], PDF[atd, Atd[[#]]]} & /@ Range[1, Length[nmer]]
A315T5uM15minIE20 = showMobilityATD[NpeakMobility, mobilitygraph, ss, 1, mercolor, 5]](https://www.wolframcloud.com/obj/resourcesystem/images/627/627f4176-7bf6-402b-8894-0cc64c03d497/2310077ea628d233.png)

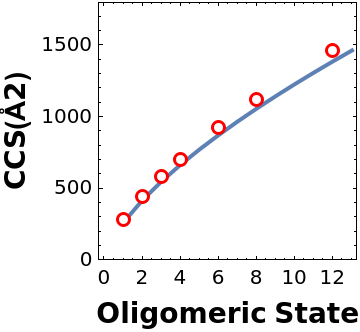
![ccs = InterpretationBox[FrameBox[TagBox[TooltipBox[PaneBox[GridBox[List[List[GraphicsBox[List[Thickness[0.0025`], List[FaceForm[List[RGBColor[0.9607843137254902`, 0.5058823529411764`, 0.19607843137254902`], Opacity[1.`]]], FilledCurveBox[List[List[List[0, 2, 0], List[0, 1, 0], List[0, 1, 0], List[0, 1, 0], List[0, 1, 0]], List[List[0, 2, 0], List[0, 1, 0], List[0, 1, 0], List[0, 1, 0], List[0, 1, 0]], List[List[0, 2, 0], List[0, 1, 0], List[0, 1, 0], List[0, 1, 0], List[0, 1, 0], List[0, 1, 0]], List[List[0, 2, 0], List[1, 3, 3], List[0, 1, 0], List[1, 3, 3], List[0, 1, 0], List[1, 3, 3], List[0, 1, 0], List[1, 3, 3], List[1, 3, 3], List[0, 1, 0], List[1, 3, 3], List[0, 1, 0], List[1, 3, 3]]], List[List[List[205.`, 22.863691329956055`], List[205.`, 212.31669425964355`], List[246.01799774169922`, 235.99870109558105`], List[369.0710144042969`, 307.0436840057373`], List[369.0710144042969`, 117.59068870544434`], List[205.`, 22.863691329956055`]], List[List[30.928985595703125`, 307.0436840057373`], List[153.98200225830078`, 235.99870109558105`], List[195.`, 212.31669425964355`], List[195.`, 22.863691329956055`], List[30.928985595703125`, 117.59068870544434`], List[30.928985595703125`, 307.0436840057373`]], List[List[200.`, 410.42970085144043`], List[364.0710144042969`, 315.7036876678467`], List[241.01799774169922`, 244.65868949890137`], List[200.`, 220.97669792175293`], List[158.98200225830078`, 244.65868949890137`], List[35.928985595703125`, 315.7036876678467`], List[200.`, 410.42970085144043`]], List[List[376.5710144042969`, 320.03370475769043`], List[202.5`, 420.53370475769043`], List[200.95300006866455`, 421.42667961120605`], List[199.04699993133545`, 421.42667961120605`], List[197.5`, 420.53370475769043`], List[23.428985595703125`, 320.03370475769043`], List[21.882003784179688`, 319.1406993865967`], List[20.928985595703125`, 317.4896984100342`], List[20.928985595703125`, 315.7036876678467`], List[20.928985595703125`, 114.70369529724121`], List[20.928985595703125`, 112.91769218444824`], List[21.882003784179688`, 111.26669120788574`], List[23.428985595703125`, 110.37369346618652`], List[197.5`, 9.87369155883789`], List[198.27300024032593`, 9.426692008972168`], List[199.13700008392334`, 9.203690528869629`], List[200.`, 9.203690528869629`], List[200.86299991607666`, 9.203690528869629`], List[201.72699999809265`, 9.426692008972168`], List[202.5`, 9.87369155883789`], List[376.5710144042969`, 110.37369346618652`], List[378.1179962158203`, 111.26669120788574`], List[379.0710144042969`, 112.91769218444824`], List[379.0710144042969`, 114.70369529724121`], List[379.0710144042969`, 315.7036876678467`], List[379.0710144042969`, 317.4896984100342`], List[378.1179962158203`, 319.1406993865967`], List[376.5710144042969`, 320.03370475769043`]]]]], List[FaceForm[List[RGBColor[0.5529411764705883`, 0.6745098039215687`, 0.8117647058823529`], Opacity[1.`]]], FilledCurveBox[List[List[List[0, 2, 0], List[0, 1, 0], List[0, 1, 0], List[0, 1, 0]]], List[List[List[44.92900085449219`, 282.59088134765625`], List[181.00001525878906`, 204.0298843383789`], List[181.00001525878906`, 46.90887451171875`], List[44.92900085449219`, 125.46986389160156`], List[44.92900085449219`, 282.59088134765625`]]]]], List[FaceForm[List[RGBColor[0.6627450980392157`, 0.803921568627451`, 0.5686274509803921`], Opacity[1.`]]], FilledCurveBox[List[List[List[0, 2, 0], List[0, 1, 0], List[0, 1, 0], List[0, 1, 0]]], List[List[List[355.0710144042969`, 282.59088134765625`], List[355.0710144042969`, 125.46986389160156`], List[219.`, 46.90887451171875`], List[219.`, 204.0298843383789`], List[355.0710144042969`, 282.59088134765625`]]]]], List[FaceForm[List[RGBColor[0.6901960784313725`, 0.5882352941176471`, 0.8117647058823529`], Opacity[1.`]]], FilledCurveBox[List[List[List[0, 2, 0], List[0, 1, 0], List[0, 1, 0], List[0, 1, 0]]], List[List[List[200.`, 394.0606994628906`], List[336.0710144042969`, 315.4997024536133`], List[200.`, 236.93968200683594`], List[63.928985595703125`, 315.4997024536133`], List[200.`, 394.0606994628906`]]]]]], List[Rule[BaselinePosition, Scaled[0.15`]], Rule[ImageSize, 10], Rule[ImageSize, 15]]], StyleBox[RowBox[List["CCSpoint", " "]], Rule[ShowAutoStyles, False], Rule[ShowStringCharacters, False], Rule[FontSize, Times[0.9`, Inherited]], Rule[FontColor, GrayLevel[0.1`]]]]], Rule[GridBoxSpacings, List[Rule["Columns", List[List[0.25`]]]]]], Rule[Alignment, List[Left, Baseline]], Rule[BaselinePosition, Baseline], Rule[FrameMargins, List[List[3, 0], List[0, 0]]], Rule[BaseStyle, List[Rule[LineSpacing, List[0, 0]], Rule[LineBreakWithin, False]]]], RowBox[List["PacletSymbol", "[", RowBox[List["\"YingyingJin/IMMSATD\"", ",", "\"YingyingJin`IMMSATD`CCSpoint\""]], "]"]], Rule[TooltipStyle, List[Rule[ShowAutoStyles, True], Rule[ShowStringCharacters, True]]]], Function[Annotation[Slot[1], Style[Defer[PacletSymbol["YingyingJin/IMMSATD", "YingyingJin`IMMSATD`CCSpoint"]], Rule[ShowStringCharacters, True]], "Tooltip"]]], Rule[Background, RGBColor[0.968`, 0.976`, 0.984`]], Rule[BaselinePosition, Baseline], Rule[DefaultBaseStyle, List[]], Rule[FrameMargins, List[List[0, 0], List[1, 1]]], Rule[FrameStyle, RGBColor[0.831`, 0.847`, 0.85`]], Rule[RoundingRadius, 4]], PacletSymbol["YingyingJin/IMMSATD", "YingyingJin`IMMSATD`CCSpoint"], Rule[Selectable, False], Rule[SelectWithContents, True], Rule[BoxID, "PacletSymbolBox"]][{Atd[[#]], 1332, 1}, t0 -> 240, T -> 303, P -> 5, n -> nmer[[#]]] & /@ Range[1, Length[nmer]];
ccsPlot = Table[{nmer[[i]], ccs[[i]]}, {i, 1, Length[nmer]}]
listISOmer = Table[{i, 265*i^(2/3)}, {i, 1, 13}];
plistISOmer = ListLinePlot[listISOmer, AspectRatio -> 1, PlotRange -> {0, 1800}, Frame -> True, FrameStyle -> Black, FrameLabel -> {Style["Oligomeric State", Bold, FontSize -> 14], Style["CCS(\[Angstrom]2)", Bold, FontSize -> 14]}, ImageSize -> Small];
A315T5uM15minIE40CCS = Show[plistISOmer, ListPlot[ccsPlot, PlotStyle -> Red, PlotMarkers -> {"OpenMarkers", Medium}]]](https://www.wolframcloud.com/obj/resourcesystem/images/627/627f4176-7bf6-402b-8894-0cc64c03d497/0931bbb75a393f95.png)
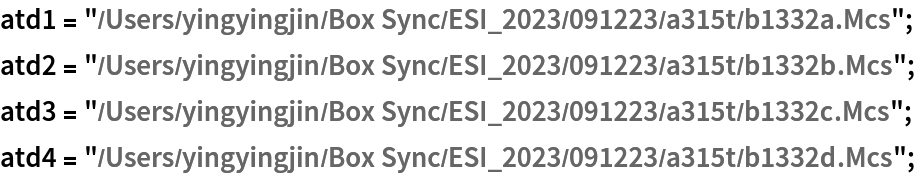
![dist = SmoothKernelDistribution[InterpretationBox[FrameBox[TagBox[TooltipBox[PaneBox[GridBox[List[List[GraphicsBox[List[Thickness[0.0025`], List[FaceForm[List[RGBColor[0.9607843137254902`, 0.5058823529411764`, 0.19607843137254902`], Opacity[1.`]]], FilledCurveBox[List[List[List[0, 2, 0], List[0, 1, 0], List[0, 1, 0], List[0, 1, 0], List[0, 1, 0]], List[List[0, 2, 0], List[0, 1, 0], List[0, 1, 0], List[0, 1, 0], List[0, 1, 0]], List[List[0, 2, 0], List[0, 1, 0], List[0, 1, 0], List[0, 1, 0], List[0, 1, 0], List[0, 1, 0]], List[List[0, 2, 0], List[1, 3, 3], List[0, 1, 0], List[1, 3, 3], List[0, 1, 0], List[1, 3, 3], List[0, 1, 0], List[1, 3, 3], List[1, 3, 3], List[0, 1, 0], List[1, 3, 3], List[0, 1, 0], List[1, 3, 3]]], List[List[List[205.`, 22.863691329956055`], List[205.`, 212.31669425964355`], List[246.01799774169922`, 235.99870109558105`], List[369.0710144042969`, 307.0436840057373`], List[369.0710144042969`, 117.59068870544434`], List[205.`, 22.863691329956055`]], List[List[30.928985595703125`, 307.0436840057373`], List[153.98200225830078`, 235.99870109558105`], List[195.`, 212.31669425964355`], List[195.`, 22.863691329956055`], List[30.928985595703125`, 117.59068870544434`], List[30.928985595703125`, 307.0436840057373`]], List[List[200.`, 410.42970085144043`], List[364.0710144042969`, 315.7036876678467`], List[241.01799774169922`, 244.65868949890137`], List[200.`, 220.97669792175293`], List[158.98200225830078`, 244.65868949890137`], List[35.928985595703125`, 315.7036876678467`], List[200.`, 410.42970085144043`]], List[List[376.5710144042969`, 320.03370475769043`], List[202.5`, 420.53370475769043`], List[200.95300006866455`, 421.42667961120605`], List[199.04699993133545`, 421.42667961120605`], List[197.5`, 420.53370475769043`], List[23.428985595703125`, 320.03370475769043`], List[21.882003784179688`, 319.1406993865967`], List[20.928985595703125`, 317.4896984100342`], List[20.928985595703125`, 315.7036876678467`], List[20.928985595703125`, 114.70369529724121`], List[20.928985595703125`, 112.91769218444824`], List[21.882003784179688`, 111.26669120788574`], List[23.428985595703125`, 110.37369346618652`], List[197.5`, 9.87369155883789`], List[198.27300024032593`, 9.426692008972168`], List[199.13700008392334`, 9.203690528869629`], List[200.`, 9.203690528869629`], List[200.86299991607666`, 9.203690528869629`], List[201.72699999809265`, 9.426692008972168`], List[202.5`, 9.87369155883789`], List[376.5710144042969`, 110.37369346618652`], List[378.1179962158203`, 111.26669120788574`], List[379.0710144042969`, 112.91769218444824`], List[379.0710144042969`, 114.70369529724121`], List[379.0710144042969`, 315.7036876678467`], List[379.0710144042969`, 317.4896984100342`], List[378.1179962158203`, 319.1406993865967`], List[376.5710144042969`, 320.03370475769043`]]]]], List[FaceForm[List[RGBColor[0.5529411764705883`, 0.6745098039215687`, 0.8117647058823529`], Opacity[1.`]]], FilledCurveBox[List[List[List[0, 2, 0], List[0, 1, 0], List[0, 1, 0], List[0, 1, 0]]], List[List[List[44.92900085449219`, 282.59088134765625`], List[181.00001525878906`, 204.0298843383789`], List[181.00001525878906`, 46.90887451171875`], List[44.92900085449219`, 125.46986389160156`], List[44.92900085449219`, 282.59088134765625`]]]]], List[FaceForm[List[RGBColor[0.6627450980392157`, 0.803921568627451`, 0.5686274509803921`], Opacity[1.`]]], FilledCurveBox[List[List[List[0, 2, 0], List[0, 1, 0], List[0, 1, 0], List[0, 1, 0]]], List[List[List[355.0710144042969`, 282.59088134765625`], List[355.0710144042969`, 125.46986389160156`], List[219.`, 46.90887451171875`], List[219.`, 204.0298843383789`], List[355.0710144042969`, 282.59088134765625`]]]]], List[FaceForm[List[RGBColor[0.6901960784313725`, 0.5882352941176471`, 0.8117647058823529`], Opacity[1.`]]], FilledCurveBox[List[List[List[0, 2, 0], List[0, 1, 0], List[0, 1, 0], List[0, 1, 0]]], List[List[List[200.`, 394.0606994628906`], List[336.0710144042969`, 315.4997024536133`], List[200.`, 236.93968200683594`], List[63.928985595703125`, 315.4997024536133`], List[200.`, 394.0606994628906`]]]]]], List[Rule[BaselinePosition, Scaled[0.15`]], Rule[ImageSize, 10], Rule[ImageSize, 15]]], StyleBox[RowBox[List["mIonCount", " "]], Rule[ShowAutoStyles, False], Rule[ShowStringCharacters, False], Rule[FontSize, Times[0.9`, Inherited]], Rule[FontColor, GrayLevel[0.1`]]]]], Rule[GridBoxSpacings, List[Rule["Columns", List[List[0.25`]]]]]], Rule[Alignment, List[Left, Baseline]], Rule[BaselinePosition, Baseline], Rule[FrameMargins, List[List[3, 0], List[0, 0]]], Rule[BaseStyle, List[Rule[LineSpacing, List[0, 0]], Rule[LineBreakWithin, False]]]], RowBox[List["PacletSymbol", "[", RowBox[List["\"YingyingJin/IMMSATD\"", ",", "\"YingyingJin`IMMSATD`mIonCount\""]], "]"]], Rule[TooltipStyle, List[Rule[ShowAutoStyles, True], Rule[ShowStringCharacters, True]]]], Function[Annotation[Slot[1], Style[Defer[PacletSymbol["YingyingJin/IMMSATD", "YingyingJin`IMMSATD`mIonCount"]], Rule[ShowStringCharacters, True]], "Tooltip"]]], Rule[Background, RGBColor[0.968`, 0.976`, 0.984`]], Rule[BaselinePosition, Baseline], Rule[DefaultBaseStyle, List[]], Rule[FrameMargins, List[List[0, 0], List[1, 1]]], Rule[FrameStyle, RGBColor[0.831`, 0.847`, 0.85`]], Rule[RoundingRadius, 4]], PacletSymbol["YingyingJin/IMMSATD", "YingyingJin`IMMSATD`mIonCount"], Rule[Selectable, False], Rule[SelectWithContents, True], Rule[BoxID, "PacletSymbolBox"]][
mcsreadatd[BinaryReadList[Atd[[#]]]]]] & /@ Range[1, Length[Atd]];
atd1332plot = Plot[PDF[dist[[#]], x], {x, 310, 950}, Frame -> True, FrameStyle -> Black, PlotRange -> {0, 0.02}, FrameStyle -> Black, AspectRatio -> 1, PlotStyle -> {Black, Thick}, PlotRange -> All] & /@ Range[1, Length[Atd]]](https://www.wolframcloud.com/obj/resourcesystem/images/627/627f4176-7bf6-402b-8894-0cc64c03d497/0caa40051dac8676.png)