YOLO V5
Trained on
MS-COCO Data
YOLO (You Only Look Once) Version 5 is a family of object detection models published in June 2020. It is a single-stage architecture that goes straight from image pixels to bounding box coordinates and class probabilities. YOLO Version 5 employs the Cross Stage Partial Networks (CSPNet) technique in its backbone to extract rich and informative features from the input image, implements the PA-NET neck for feature aggregation and uses the SiLU function for its activations. Its training leverages several novel data augmentation techniques such as mosaic augmentation and cutout (also used in YOLO Version 4), helping the model to recognize small objects. The YOLO Version 5 S model is about 90% smaller than YOLOv4-custom (with Darknet architecture), meaning that it can be deployed to embedded devices much more easily. It is also faster in both training and inference, achieving 140 frames per second in batch.
Examples
Resource retrieval
Get the pre-trained net:
NetModel parameters
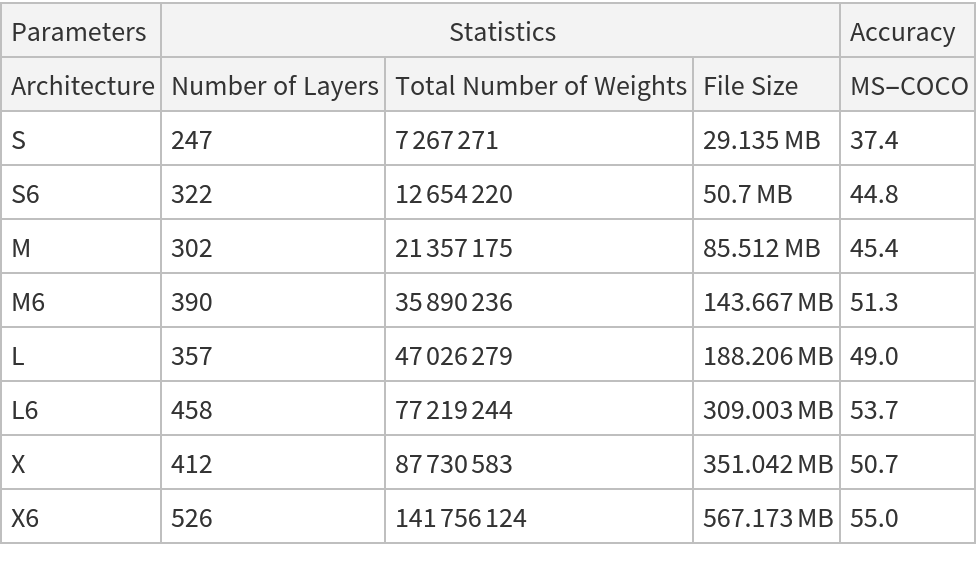
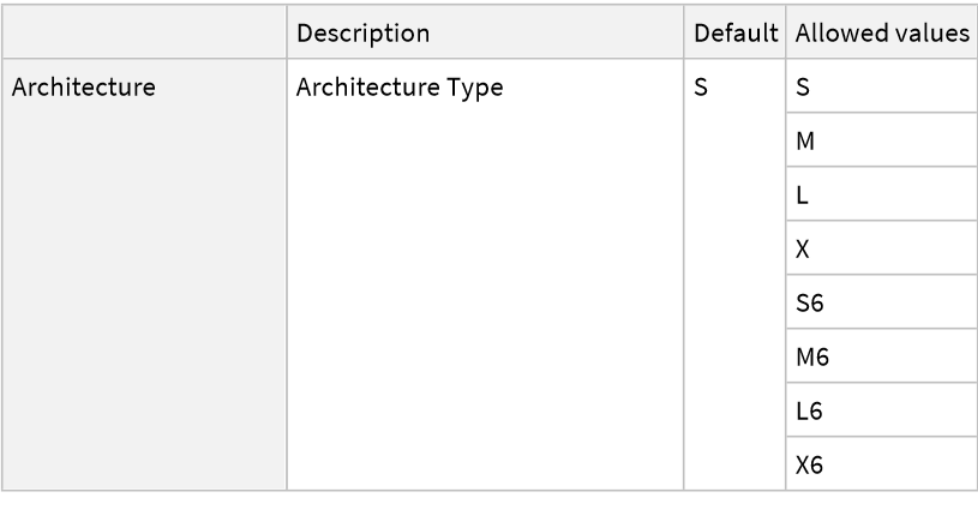
This model consists of a family of individual nets, each identified by a specific parameter combination. Inspect the available parameters:
Pick a non-default net by specifying the parameters:
Pick a non-default uninitialized net:
Evaluation function
Write an evaluation function to scale the result to the input image size and suppress the least probable detections:
Basic usage
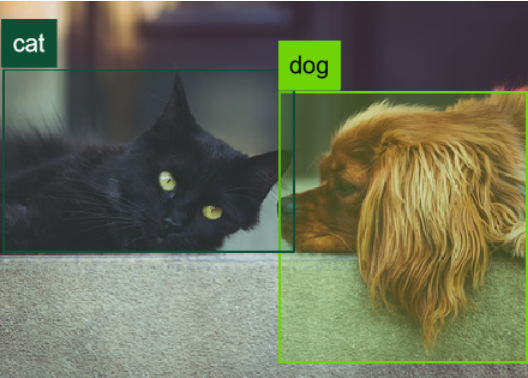
Obtain the detected bounding boxes with their corresponding classes and confidences for a given image:
Inspect which classes are detected:
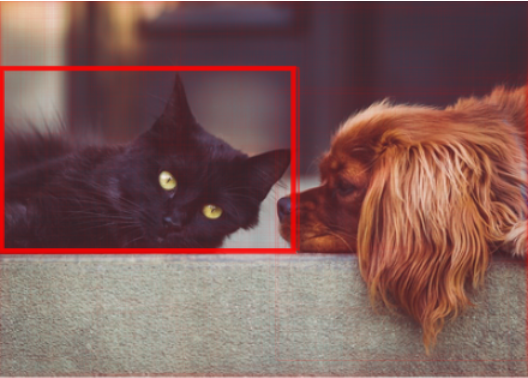
Visualize the detection:
Network result
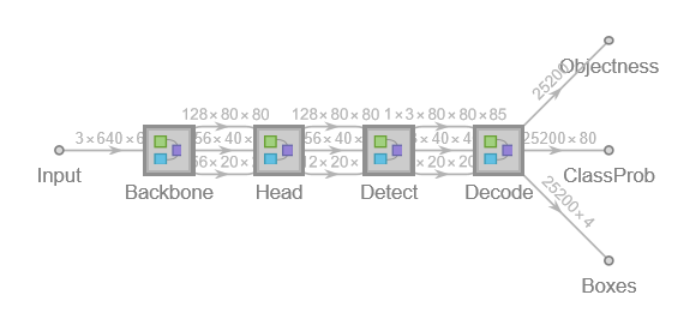
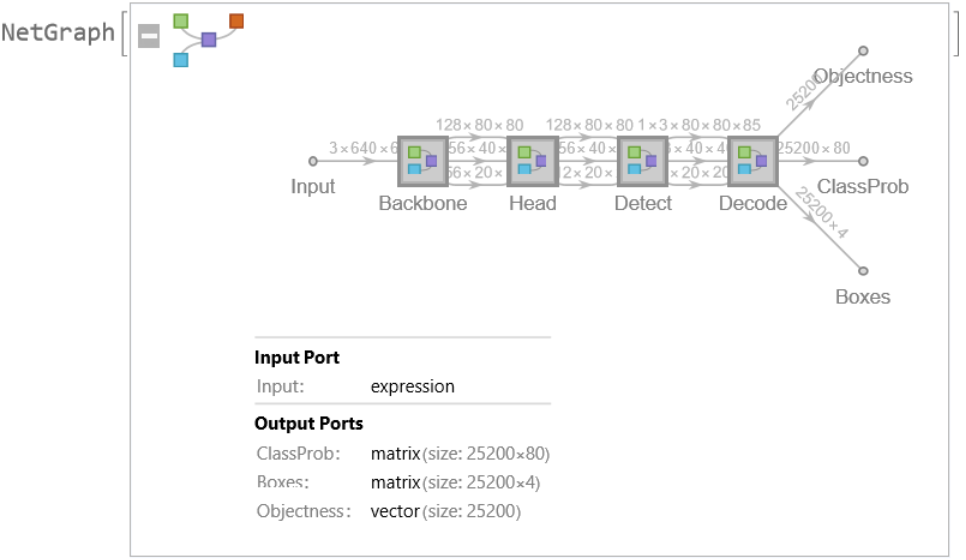
The network computes 25,200 bounding boxes and the probability that the objects in each box are of any given class:
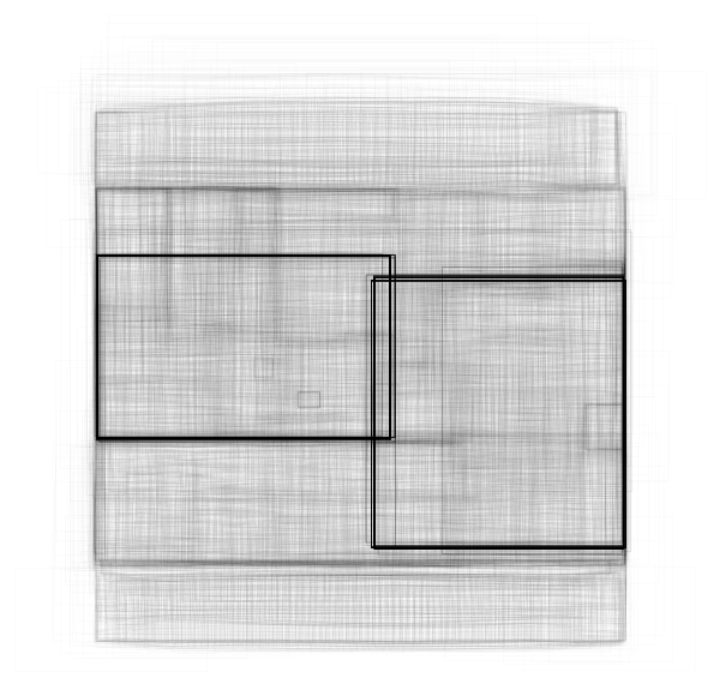
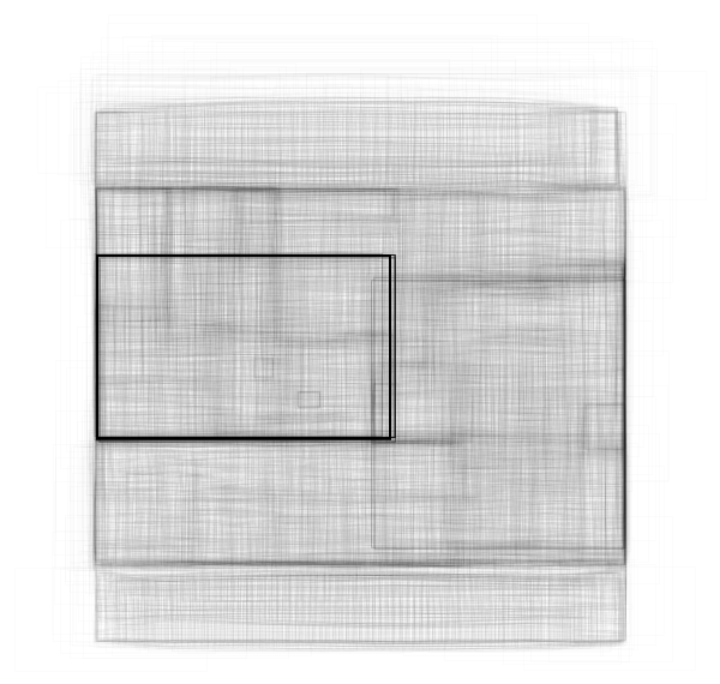
Rescale the bounding boxes to the coordinates of the input image and visualize them scaled by their "objectness" measures:
Visualize all the boxes scaled by the probability that they contain a cat:
Superimpose the cat prediction on top of the input received by the net:
Net information
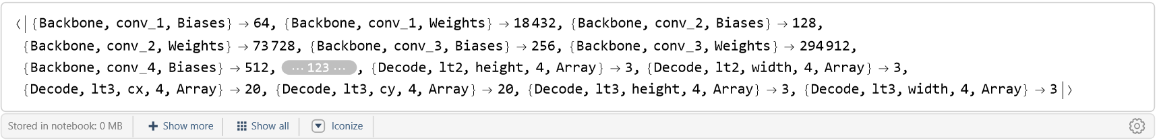
Inspect the number of parameters of all arrays in the net:
Obtain the total number of parameters:
Obtain the layer type counts:
Display the summary graphic:
Resource History
Reference
![netevaluate[model_, img_, detectionThreshold_ : .5, overlapThreshold_ : .5] := Module[{imgSize, classes, coords, obj, scores, bestClass, probable, probableClasses, probableScores, probableBoxes, h, w, max, scale, padding, nms, finals},
imgSize = Last@NetExtract[model, {"Input", "Output"}];
{classes, coords, obj} = Values@model[img];
(*each class probability is rescaled with the box objectness*) scores = classes*obj;
bestClass = Last@*Ordering /@ scores;
(*filter by probability*)
(*very small probability are thresholded*) probable = UnitStep[obj - detectionThreshold]; {probableClasses, probableBoxes, probableScores} = Map[Pick[#, probable, 1] &, {labels[[bestClass]], coords, obj}];
If[Length[probableBoxes] == 0, Return[{}]];
(*transform coordinates into rectangular boxes*)
{w, h} = ImageDimensions[img];
max = Max[{w, h}];
scale = max/imgSize ;
padding = imgSize*(1 - {w, h}/max)/2;
probableBoxes = Apply[
Rectangle[
scale*({#1 - #3/2, imgSize - #2 - #4/2} - padding),
scale*({#1 + #3/2, imgSize - #2 + #4/2} - padding)
] &, probableBoxes, 1];
(*gather the boxes of the same class and perform non-
max suppression*) nms = nonMaximumSuppression[probableBoxes -> probableScores, "Index"];
finals = Transpose[{probableBoxes, probableClasses, probableScores}];
Part[finals, nms]
];](https://www.wolframcloud.com/obj/resourcesystem/images/d25/d2578c2c-3d68-49e3-9500-aea15e770006/4715d59fff9b0aea.png)
![(* Evaluate this cell to get the example input *) CloudGet["https://www.wolframcloud.com/obj/27231989-3929-44d2-abdf-3c485f6776af"]](https://www.wolframcloud.com/obj/resourcesystem/images/d25/d2578c2c-3d68-49e3-9500-aea15e770006/46ed3e71f2952a57.png)
![rectangles = Block[
{w, h, max, imgSize, scale, padding},
{w, h} = ImageDimensions[testImage];
max = Max[{w, h}];
imgSize = 640;
scale = max/imgSize ;
padding = imgSize*(1 - {w, h}/max)/2;
Apply[
Rectangle[
scale*({#1 - #3/2, imgSize - #2 - #4/2} - padding),
scale*({#1 + #3/2, imgSize - #2 + #4/2} - padding)
] &,
res["Boxes"],
1
]
];](https://www.wolframcloud.com/obj/resourcesystem/images/d25/d2578c2c-3d68-49e3-9500-aea15e770006/1a98e30de746f7a8.png)
![Graphics[
MapThread[{EdgeForm[Opacity[#1 + .01]], #2} &, {res["Objectness"]*
Extract[res["ClassProb"], {All, idx}], rectangles}],
BaseStyle -> {FaceForm[], EdgeForm[{Thin, Black}]}
]](https://www.wolframcloud.com/obj/resourcesystem/images/d25/d2578c2c-3d68-49e3-9500-aea15e770006/68332fa2d85ccd31.png)
![HighlightImage[testImage, Graphics[MapThread[{EdgeForm[{Thickness[#1/100], Opacity[(#1 + .01)/3]}], #2} &, {res["Objectness"]*
Extract[res["ClassProb"], {All, idx}], rectangles}]], BaseStyle -> {FaceForm[], EdgeForm[{Thin, Red}]}]](https://www.wolframcloud.com/obj/resourcesystem/images/d25/d2578c2c-3d68-49e3-9500-aea15e770006/5a92a34dfddede91.png)