Resource retrieval
Get the pre-trained net:
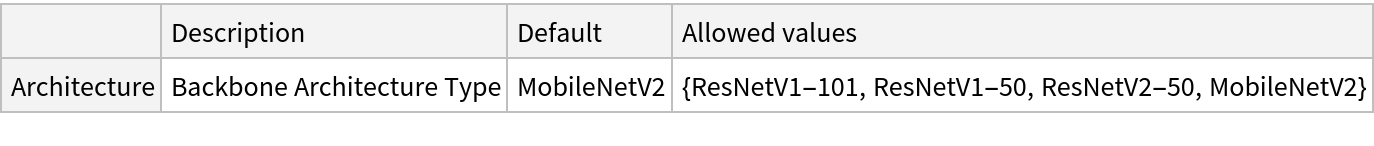
NetModel parameters
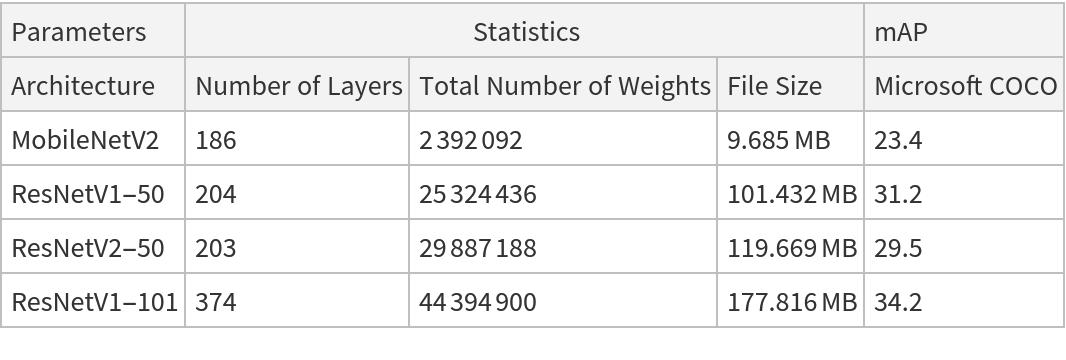
This model consists of a family of individual nets, each identified by a specific parameter combination. Inspect the available parameters:
Pick a non-default net by specifying the parameters:
Pick a non-default uninitialized net:
Evaluation function
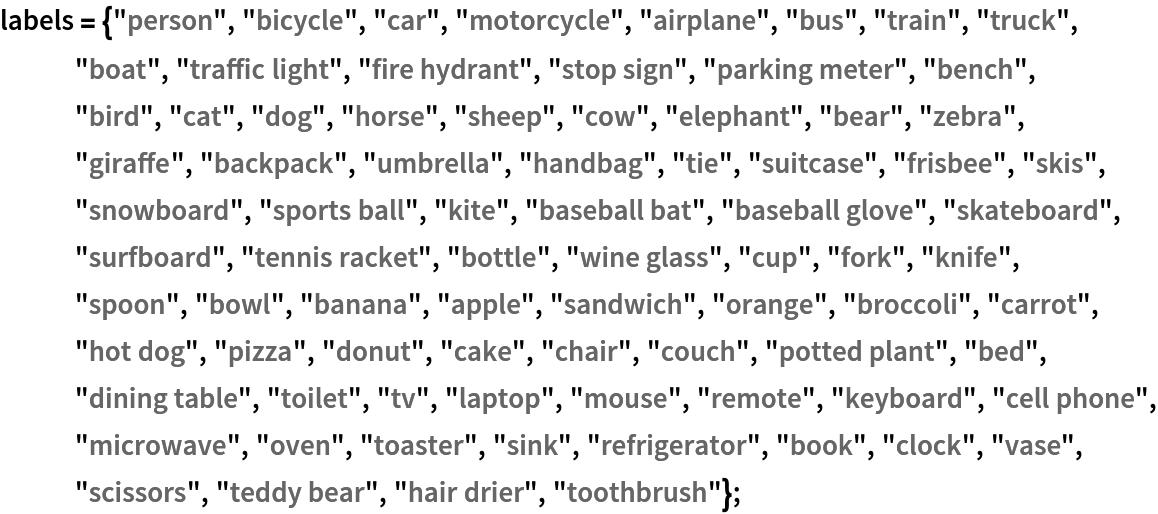
Define the label list for this model:
Write an evaluation function to scale the result to the input image size and suppress the least probable detections:
Basic usage
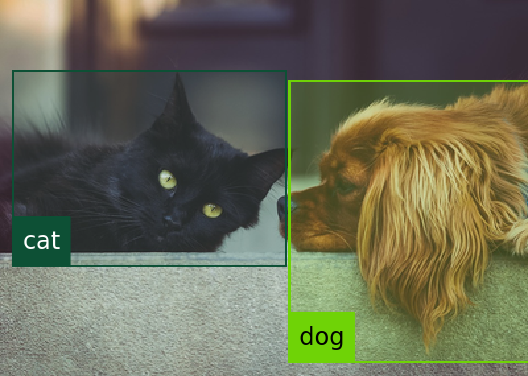
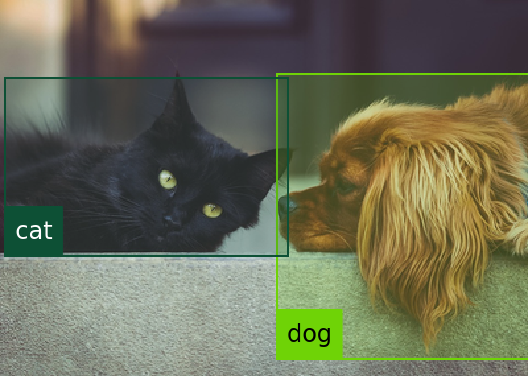
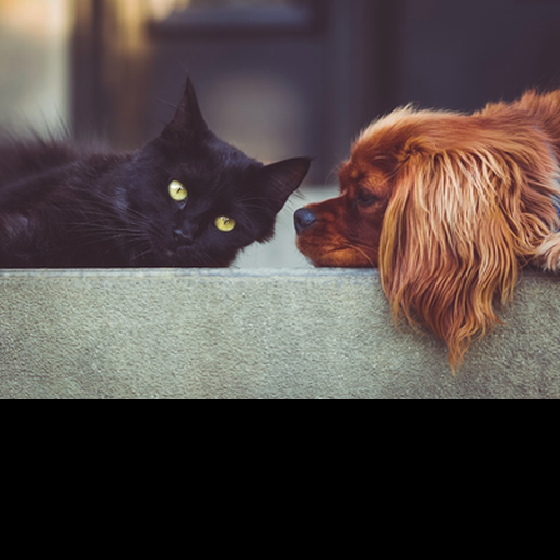
Obtain the detected bounding boxes with their corresponding classes and confidences for a given image:
Inspect which classes are detected:
Visualize the detection:
Network result
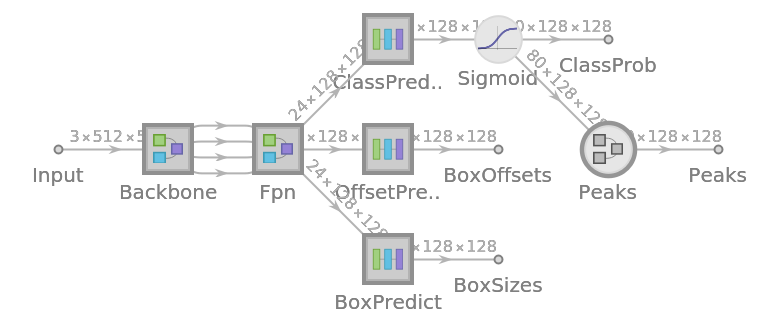
For the default input size of 512x512, the net produces 128x128 bounding boxes whose centers mostly follow a square grid. For each bounding box, the net produces the box’s size and the offset of the box’s center with respect to the square grid:
Change coordinate system into a graphics domain:
Compute and visualize the box center positions:
Visualize the box center positions. They follow a square grid with offsets:
Compute the boxes coordinates:
Define a function to rescale the box coordinates to the original image size:
Visualize all the boxes predicted by the net scaled by their "objectness" measures:
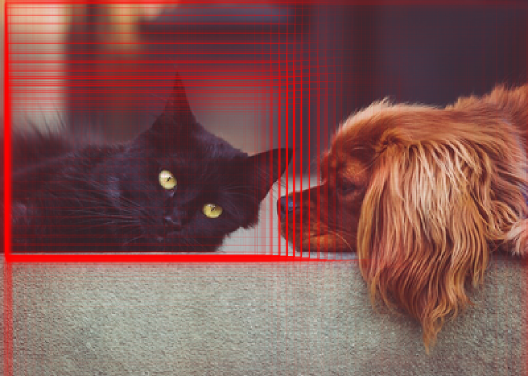
Visualize all the boxes scaled by the probability that they contain a cat:
Superimpose the cat prediction on top of the scaled input received by the net:
Heat map visualization
Every box is associated to a scalar strength value indicating the likelihood that the patch contains an object:
The strength of each patch is the maximal element aggregated across all classes. Obtain the strength of each patch:
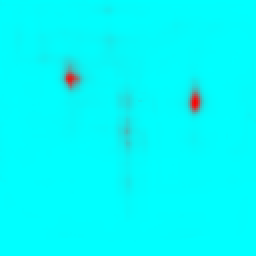
Visualize the strength of each patch as a heat map:
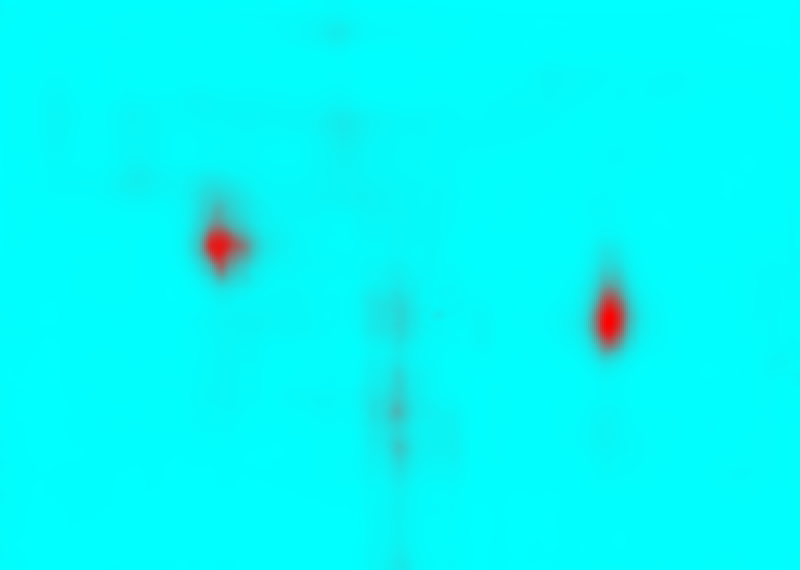
Stretch and unpad the heat map to the original image domain:
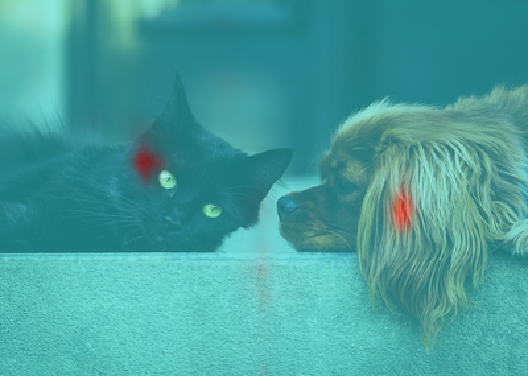
Overlay the heat map on the image:
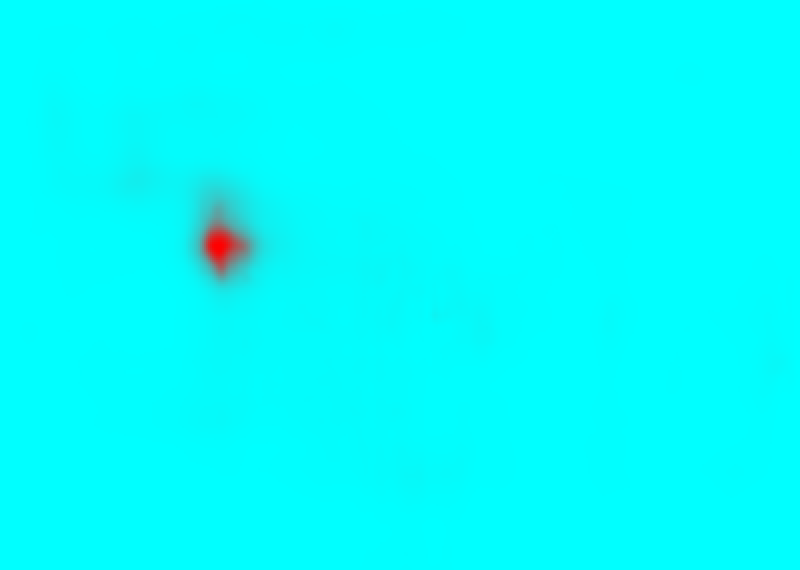
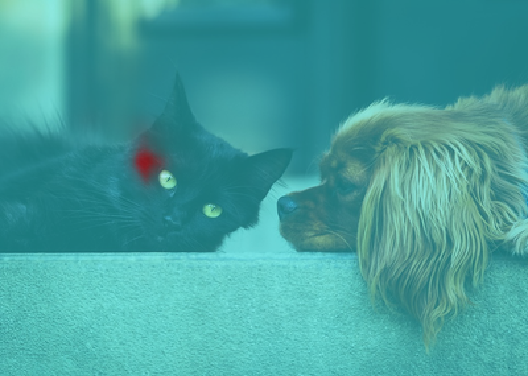
Obtain and visualize the strength of each patch for the "cat" class:
Overlay the heat map on the image:
Adapt to any size
Automatic image resizing can be avoided by replacing the NetEncoder. First get the NetEncoder:
Note that the NetEncoder resizes the image by keeping the aspect ratio and then pads the result to have a fixed shape of 512x512. Visualize the output of NetEncoder adjusting for brightness:
Create a new NetEncoder with the desired dimensions:
Attach the new NetEncoder:
Obtain the detected bounding boxes with their corresponding classes and confidences for a given image:
Visualize the detection:
Note that even though the localization results and the box confidences are slightly worse compared to the original net, the resized network runs significantly faster:
Net information
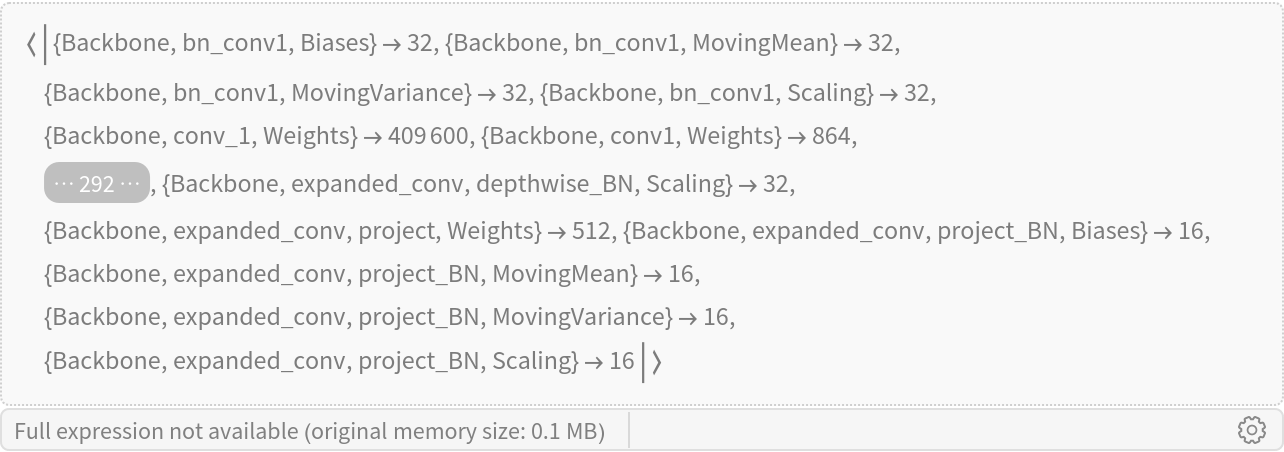
Inspect the number of parameters of all arrays in the net:
Obtain the total number of parameters:
Obtain the layer type counts:
Display the summary graphic:
![Options[netevaluate] = {MaxFeatures -> 100, AcceptanceThreshold -> 0.1^6};
netevaluate[net_, img_Image, detectionThreshold_ : 0.5, opts : OptionsPattern[]] := Module[{
netOut, w, h, fc, fh, fw, flatHeatMapCenter, flatProbsCenter, suppresedPeaksCenter, newProbsCenter, flatPosCenter, posCenter, highScoredCenter,
detectionsPerClass, filteredClassIdx, uniqueClasses, classes, scale, pHpW, offsetHw, boxCoordinates, tuples
},
netOut = net[img];
{w, h} = ImageDimensions[img];
{fc, fh, fw} = Dimensions[netOut["Peaks"]];
(*Extract Peaks*)
{flatHeatMapCenter, flatProbsCenter} = Map[Transpose@Flatten[Transpose[#, {3, 1, 2}], {1, 2}] &, {netOut[
"Peaks"], netOut["ClassProb"]}];
suppresedPeaksCenter = UnitStep[OptionValue[AcceptanceThreshold] - flatHeatMapCenter];
newProbsCenter = flatProbsCenter*suppresedPeaksCenter;
(*Find positions of (up to) MaxFeatures strongest keypoints*)
flatPosCenter = Map[Ordering[#, -Min[OptionValue[MaxFeatures], fw*fh]] &, newProbsCenter];
posCenter = QuotientRemainder[flatPosCenter - 1, fw] + 1;
newProbsCenter = MapThread[#1[[#2]] &, {newProbsCenter, flatPosCenter}];
(*Filter low-scored detections*)
highScoredCenter = UnitStep[newProbsCenter - detectionThreshold];
If[Total[highScoredCenter] == 0, Return[]];
{posCenter, newProbsCenter} = Map[Pick[#, highScoredCenter, 1] &, {posCenter, newProbsCenter}];
detectionsPerClass = Map[Total, highScoredCenter];
filteredClassIdx = UnitStep[detectionsPerClass - 1];
{detectionsPerClass, uniqueClasses} = Map[Pick[#, filteredClassIdx, 1] &, {detectionsPerClass, labels}];
classes = Flatten[MapThread[
ConstantArray[#1, #2] &, {uniqueClasses, detectionsPerClass}], 1];
{posCenter, newProbsCenter} = Map[Flatten[Pick[#, filteredClassIdx, 1], 1] &, {posCenter, newProbsCenter}];
(*From array positions to image keypoint positions*)
scale = Max@N[{w, h}/{fw, fh}];
{pHpW, offsetHw} = Map[Extract[#, Prepend[All] /@ posCenter] &, {netOut[["BoxSizes"]],
netOut[["BoxOffsets"]]}];
boxCoordinates = Transpose[{Reverse[posCenter - 0.5*pHpW + offsetHw, 2], Reverse[posCenter + 0.5*pHpW + offsetHw, 2]}];
boxCoordinates = Rectangle @@@ MapAt[h - # &, boxCoordinates*scale, {All, All, 2}];
(*Extract the features and strengths*)
tuples = MaximalBy[Transpose[{boxCoordinates, classes, newProbsCenter}], Last, UpTo[OptionValue@MaxFeatures]];
tuples
]](https://www.wolframcloud.com/obj/resourcesystem/images/739/73948ccd-7c3b-44a7-afa4-cbb1a82151b8/2be0ccb2c0344e31.png)
![(* Evaluate this cell to get the example input *) CloudGet["https://www.wolframcloud.com/obj/ea76869c-40be-4a4f-a0f8-693e9473d199"]](https://www.wolframcloud.com/obj/resourcesystem/images/739/73948ccd-7c3b-44a7-afa4-cbb1a82151b8/2662d811d673195c.png)
![res = Map[Transpose[#, {3, 2, 1}] &, res];
res["BoxOffsets"] = Map[Reverse, res["BoxOffsets"], {2}];
res["BoxSizes"] = Map[Reverse, res["BoxSizes"], {2}];](https://www.wolframcloud.com/obj/resourcesystem/images/739/73948ccd-7c3b-44a7-afa4-cbb1a82151b8/5a12513662ba1f4e.png)

![Graphics[
MapThread[{EdgeForm[Opacity[Total[#1]*0.5]], #2} &, {Flatten@
Map[Max, res["ClassProb"], {2}], Map[boxDecoder[#, {128, 128}, 1] &, boxes]}],
BaseStyle -> {FaceForm[], EdgeForm[{Thin, Black}]}
]](https://www.wolframcloud.com/obj/resourcesystem/images/739/73948ccd-7c3b-44a7-afa4-cbb1a82151b8/5805e9ae2b7be1b5.png)

![Graphics[
MapThread[{EdgeForm[Opacity[#1]], Rectangle @@ #2} &, {Flatten[
res["ClassProb"][[All, All, idx]]], Map[boxDecoder[#, {128, 128}, 1] &, boxes]}],
BaseStyle -> {FaceForm[], EdgeForm[{Thin, Black}]}
]](https://www.wolframcloud.com/obj/resourcesystem/images/739/73948ccd-7c3b-44a7-afa4-cbb1a82151b8/0c8844ce688dadb7.png)

![HighlightImage[testImage, Graphics[
MapThread[{EdgeForm[{Opacity[#1]}], #2} &, {Flatten[
res["ClassProb"][[All, All, idx]]], Map[boxDecoder[#, ImageDimensions[testImage], Max@N[ImageDimensions[testImage]/{128, 128}]] &, boxes]}]], BaseStyle -> {FaceForm[], EdgeForm[{Thin, Red}]}]](https://www.wolframcloud.com/obj/resourcesystem/images/739/73948ccd-7c3b-44a7-afa4-cbb1a82151b8/7dd194955de2fc03.png)
![strengthArray = classProbs[[idx]];
heatmap = ImageApply[{#, 1 - #, 1 - #} &, ImageAdjust@Image[strengthArray]];
heatmap = ImageTake[
ImageResize[heatmap, {Max[#]}], {1, Last[#]}, {1, First[#]}] &@
ImageDimensions[testImage]](https://www.wolframcloud.com/obj/resourcesystem/images/739/73948ccd-7c3b-44a7-afa4-cbb1a82151b8/7213b94bbdc0efe6.png)
![newEncoder = NetEncoder[{"Image", {320, 320}, Method -> "Fit", Alignment -> {Left, Top}, "MeanImage" -> NetExtract[encoder, "MeanImage"], "VarianceImage" -> NetExtract[encoder, "VarianceImage"]}]](https://www.wolframcloud.com/obj/resourcesystem/images/739/73948ccd-7c3b-44a7-afa4-cbb1a82151b8/477f4c42dcf591c5.png)