Wolfram Function Repository
Instant-use add-on functions for the Wolfram Language
Function Repository Resource:
Plot the Frenet-Serret frame of a curve
ResourceFunction["FrenetSerretFrame"][c,t0,{t,tmin,tmax}] plots the curve c with parameter t from tmin to tmax, with the Frenet-Serret frame for c at t0. |
A figure eight:
| In[1]:= |
The Frenet–Serret frame:
| In[2]:= |
| Out[2]= | 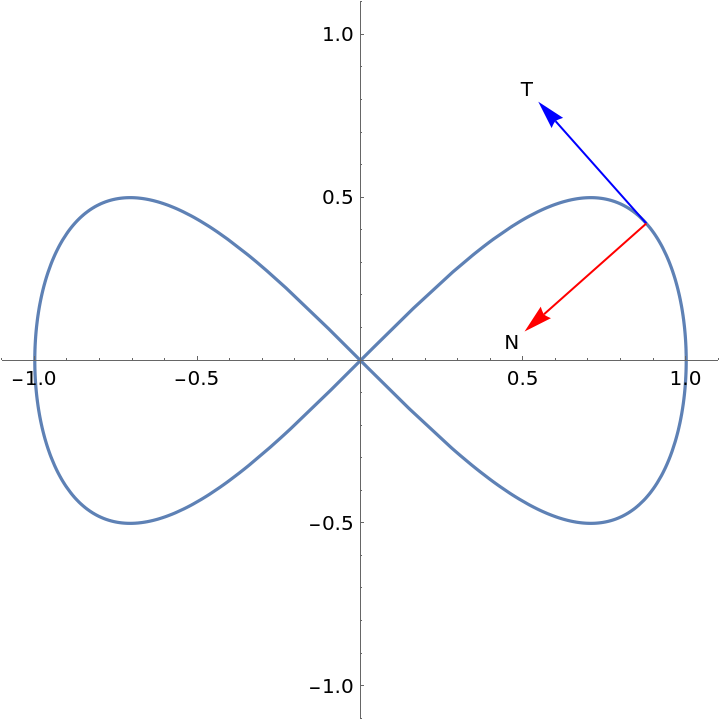 |
See how the system changes as t0 is varied:
| In[3]:= |
| Out[4]= | 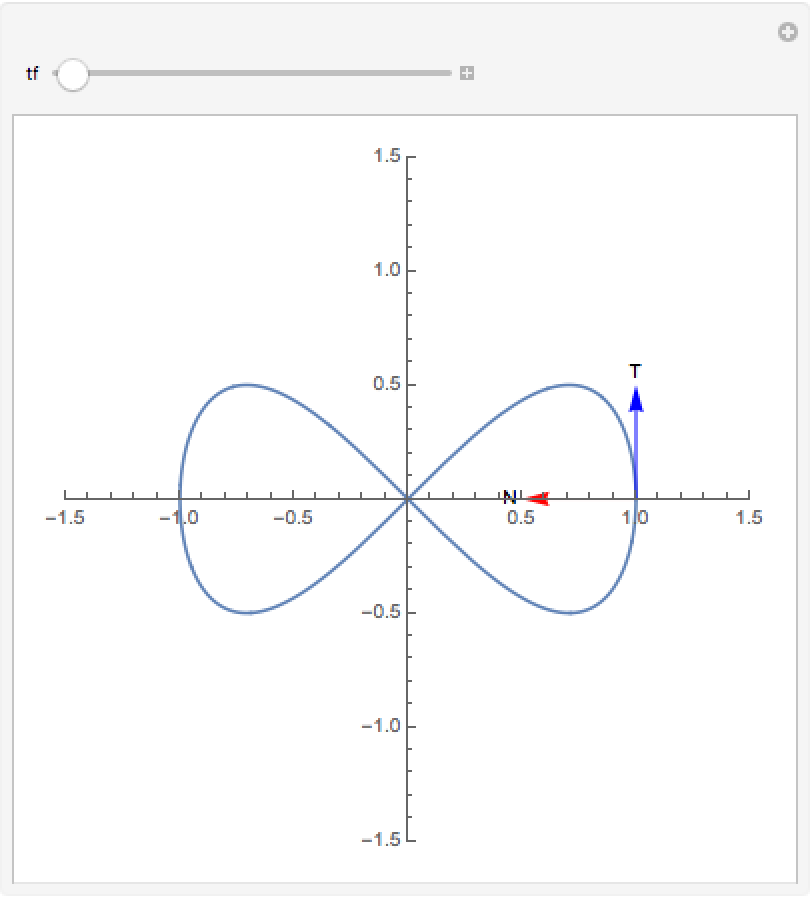 |
Viviani’s curve:
| In[5]:= |
| Out[5]= |
Viviani’s curve with an animation of the tangent, normal and binormal moving along the curve:
| In[6]:= | ![Manipulate[
Show[ResourceFunction["FrenetSerretFrame"][viviani, tf, {t, 0, 4 \[Pi]}, PlotRange -> 1.5], Graphics3D[{Opacity[.5], Sphere[]}]], {{tf, 2}, 0, 4 \[Pi]}]](https://www.wolframcloud.com/obj/resourcesystem/images/b03/b03a8b28-94d6-448e-b05c-9cc3800adc33/289c26b29998ce1e.png) |
| Out[6]= | 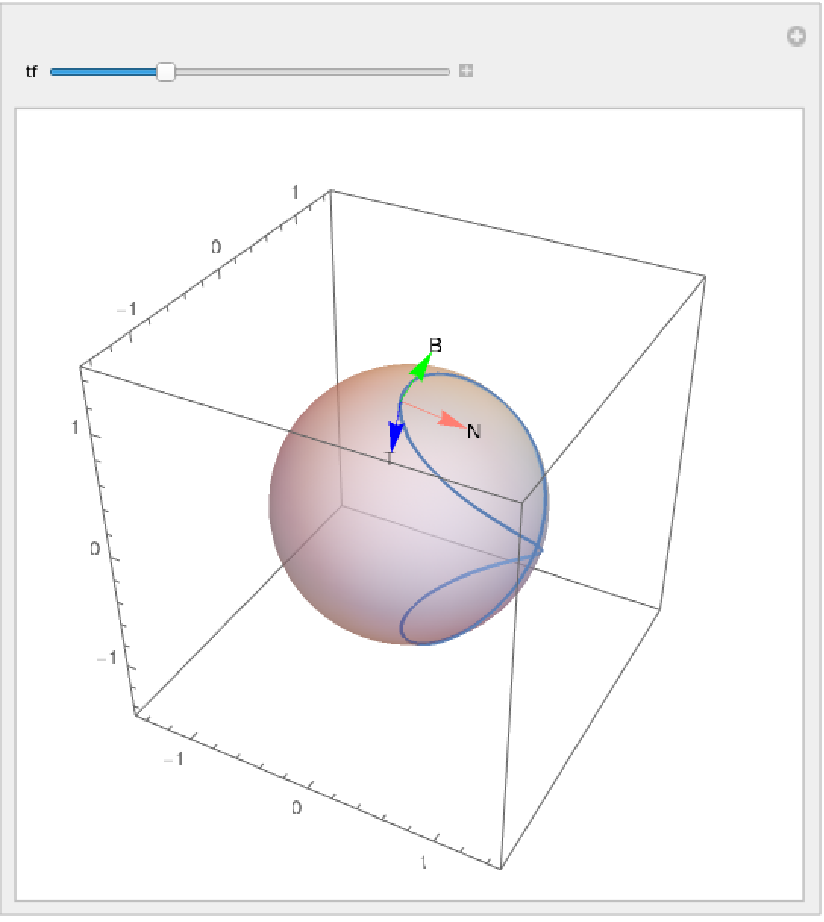 |
Modify the length of vectors:
| In[7]:= | ![Module[{tf = 4}, Show[ResourceFunction[
"FrenetSerretFrame"][{1/2 (1 + Cos[t]), Sin[t]/2, Sin[t/2]}, tf, {t, 0, 4 \[Pi]}, PlotRange -> 1.75, "ScaleFactor" -> 1],
Graphics3D[{Opacity[0.5`], Sphere[]}]]]](https://www.wolframcloud.com/obj/resourcesystem/images/b03/b03a8b28-94d6-448e-b05c-9cc3800adc33/4ba263cd9849d1fd.png) |
| Out[7]= | 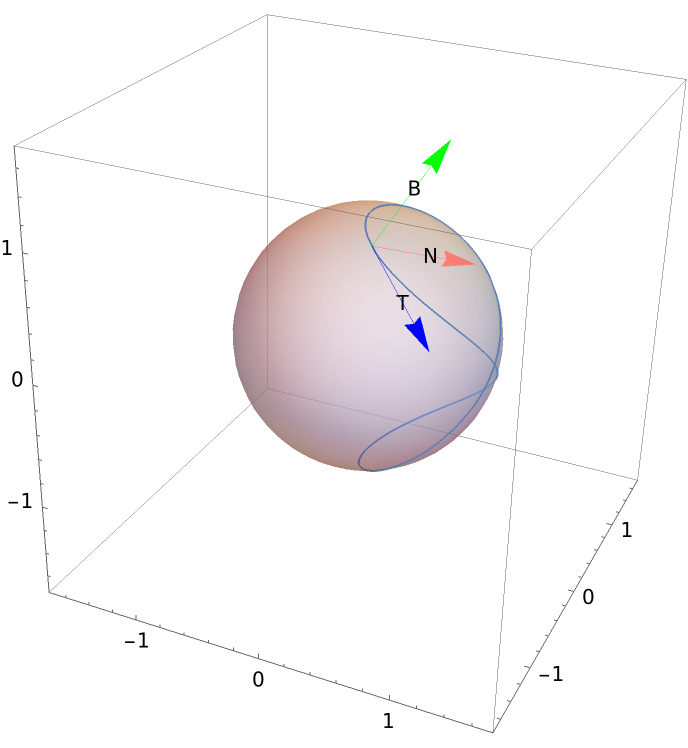 |
Change the style of vectors:
| In[8]:= | ![Module[{tf = 4}, Show[ResourceFunction[
"FrenetSerretFrame"][{1/2 (1 + Cos[t]), Sin[t]/2, Sin[t/2]}, tf, {t, 0, 4 \[Pi]}, PlotRange -> 1.5, "FrameStyle" -> {Directive[Dashed], Directive[Red, Dashing[0], Thick], Directive[Yellow]}], Graphics3D[{Opacity[0.5`], Sphere[]}]]]](https://www.wolframcloud.com/obj/resourcesystem/images/b03/b03a8b28-94d6-448e-b05c-9cc3800adc33/67c38675858686e0.png) |
| Out[8]= | 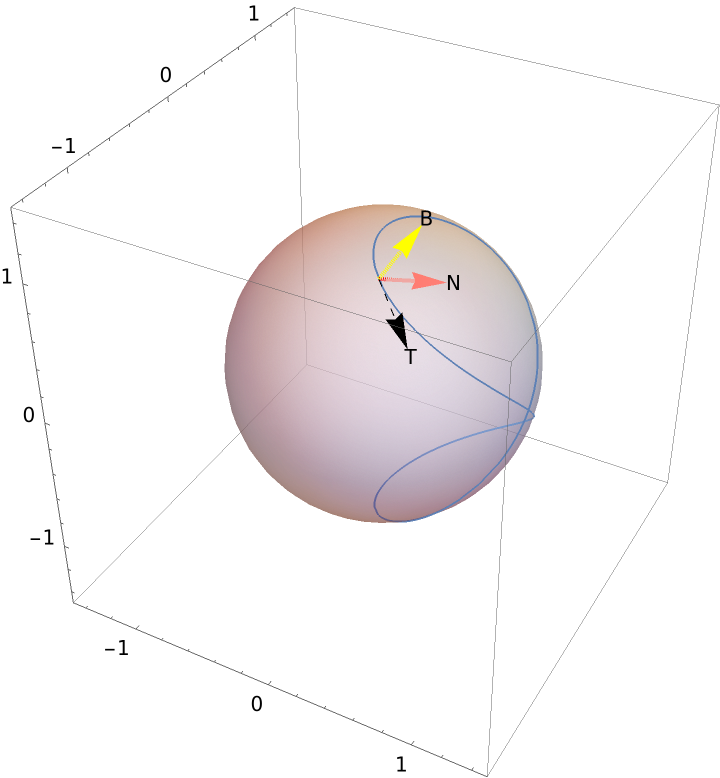 |
Change the text for vectors of the frame:
| In[9]:= | ![Module[{tf = 4}, Show[ResourceFunction[
"FrenetSerretFrame"][{1/2 (1 + Cos[t]), Sin[t]/2, Sin[t/2]}, tf, {t, 0, 4 \[Pi]}, PlotRange -> 1.5, "FrameText" -> {"1", "2", "3"}],
Graphics3D[{Opacity[0.5`], Sphere[]}]]]](https://www.wolframcloud.com/obj/resourcesystem/images/b03/b03a8b28-94d6-448e-b05c-9cc3800adc33/6c135b3008ec5b42.png) |
| Out[9]= | 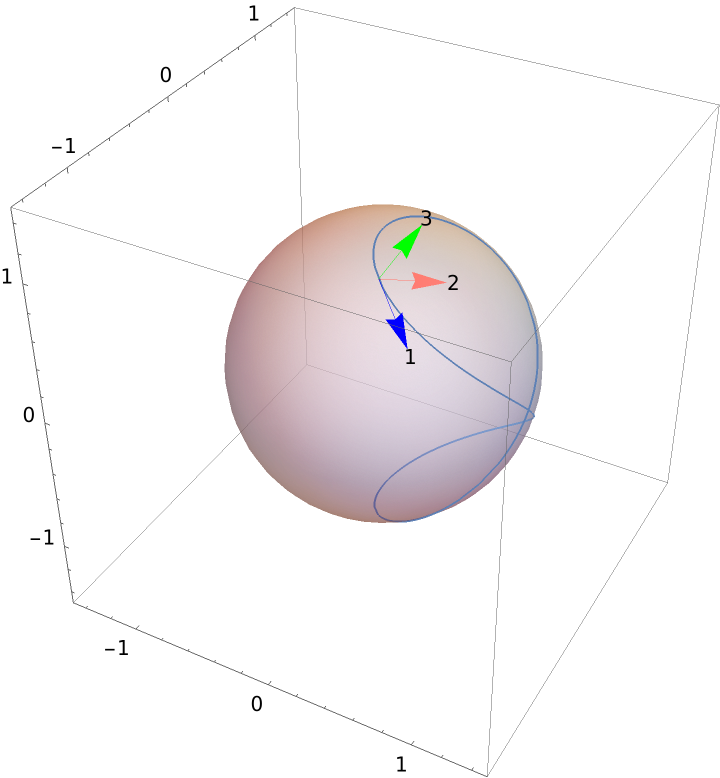 |
Adjust the text position:
| In[10]:= | ![Module[{tf = 4}, Show[ResourceFunction[
"FrenetSerretFrame"][{1/2 (1 + Cos[t]), Sin[t]/2, Sin[t/2]}, tf, {t, 0, 4 \[Pi]}, PlotRange -> 1.5, "FrameTextPosition" -> -{0.25, 0.25, 0.25}],
Graphics3D[{Opacity[0.5`], Sphere[]}]]]](https://www.wolframcloud.com/obj/resourcesystem/images/b03/b03a8b28-94d6-448e-b05c-9cc3800adc33/142d354d8c708964.png) |
| Out[10]= |  |
This work is licensed under a Creative Commons Attribution 4.0 International License