A work cell in a machine shop consists of three machines, where on a given day a machine fails with probability p=0.1. Machine 1 feeds both machines 2 and 3, and if machine 1 fails, there is no production that day. Only one machine can be repaired on the same day so it is available for the following day. If several machines are down, they are repaired in priority order 1, 2, and 3. A machine that has been repaired is assumed to be working the next day. Find the proportion of time there can be some production.
The failure and repair process can be modeled as a discrete Markov process by enumerating all possible combinations of failed and working machines:
In[1]:=
failed=Subsets[{1,2,3}]
Out[1]=
{{},{1},{2},{3},{1,2},{1,3},{2,3},{1,2,3}}
Next steps build the transition matrix (shows the probability of moving from one state to another in one step) by evaluating next-day probabilities from each state to every possible next-day state. Start with either zero or one machines down.
If no machine is down, one or several machines can fail the next day:
In[2]:=
transition[i_,j_]/;Length[i]0:=
Length[j]
p
3-Length[j]
(1-p)
If one machine is down; it is repaired and one or both of the other ones can fail:
Create a discrete Markov process, starting with all machines working:
In[9]:=
=DiscreteMarkovProcess[1,m];
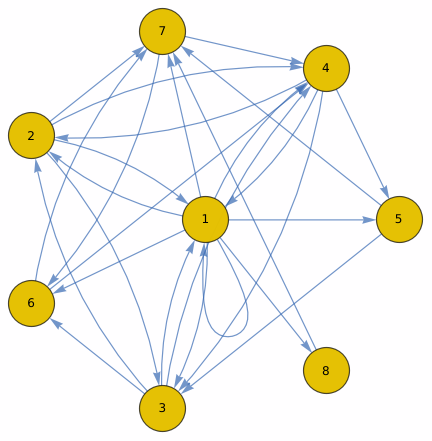
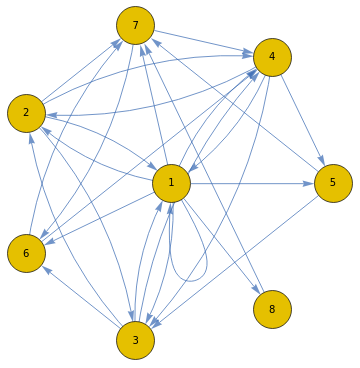
Visualize the Markov chain as a graph:
In[10]:=
Graph[,GraphLayout"BalloonEmbedding"]
Out[10]=
Indicate the indices of the productive states (either no machine is down, or one of machines 2 or 3 down)
In[11]:=
Position[failed,{}|{2}|{3}]
Out[11]=
{{1},{3},{4}}
Evaluate the steady-state probability of production by summing the productive states from the stationary distribution (a probability vector which shows the long-term outcome of the system):