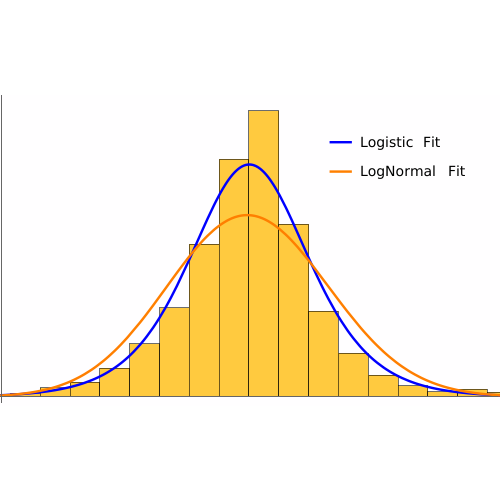
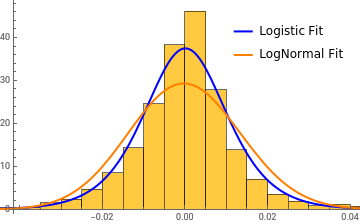
A logistic distribution provides a good fit for daily fractional price changes in financial markets. Estimate and compare the logistic and lognormal distributions for the S&P 500 index’s daily fractional price changes from January 1, 2000, to January 1, 2009, and evaluate which model better represents the data.
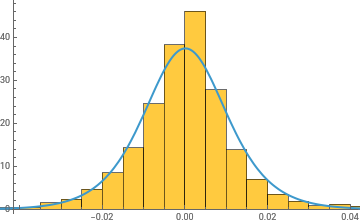
Retrieve daily fractional price changes of the S&P 500 index between 2000 and 2009 as a time series:
Perform hypothesis tests to evaluate how well each distribution fits the data and present p-values side-by-side for comparison. Higher p-values indicate that the observed data are consistent with the corresponding model; the logistic distribution generally yields a better fit for symmetric price-change data.