The dataset used here comes from the UCI Machine Learning Repository, which consists of data from 1,541 patients including age, cholesterol level, resting blood pressure and heart disease diagnosis. A smaller version of the dataset is available from the Wolfram Data Repository.
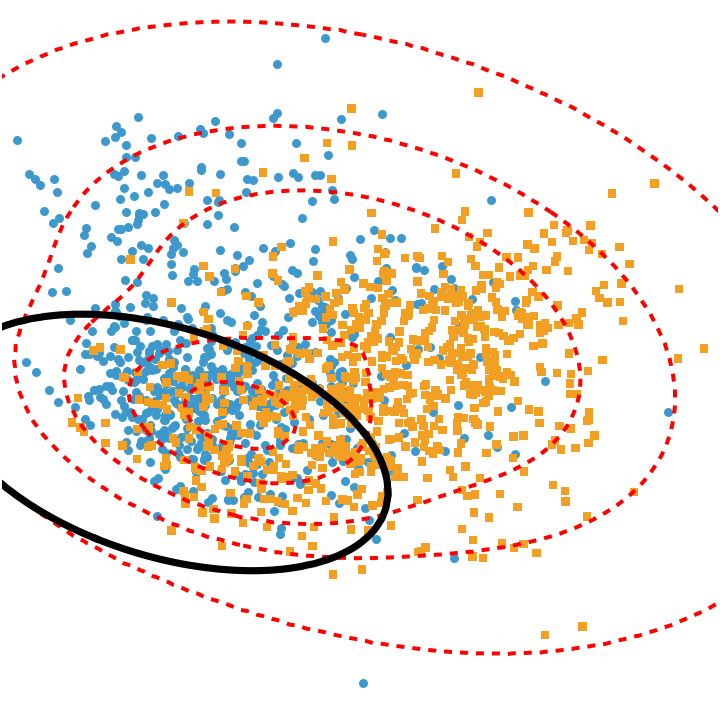
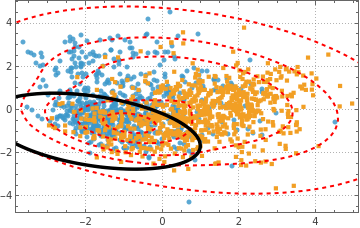
Based on the mixture model, plot the decision boundary (black curve) and probability density contours (red curve) of the mixture model and show them together with the scatter plot: