Wolfram.com
WolframAlpha.com
WolframCloud.com
Wolfram Language
Example Repository
Ready-to-use examples of Wolfram Language
Primary Navigation
Categories
Algebra
Astronomy
Audio Processing
Calculus
Cellular Automata
Chemistry
Complex Systems
Computer Science
Computer Vision
Control Systems
Creative Arts
Data Science
Engineering
Finance & Economics
Finite Element Method
Food & Nutrition
Geography
Geometry
Graphs & Networks
Image Processing
Life Sciences
Machine Learning
Mathematics
Optimization
Physics
Probability & Statistics
Puzzles and Recreation
Quantum Computation
Signal Processing
Social Sciences
System Modeling
Tabular Processing
Text & Language Processing
Time-Related Computation
Video Processing
Visualization & Graphics
Alphabetical List
Submit a New Example
Learn More about
Wolfram Language
Related Pages
Related Symbols
AirTemperatureData
Entity
MinMax
MovingMap
DateListPlot
Related Categories
Geography
Data Science
Visualize a Time Series of Temperature Data
Example Notebook
Open in Cloud
Download Notebook
Obtain the air temperature data for the city of Yakutsk over a period of 15 years:
I
n
[
1
]
:
=
d
a
t
a
=
A
i
r
T
e
m
p
e
r
a
t
u
r
e
D
a
t
a
Y
a
k
u
t
s
k
C
I
T
Y
,
{
{
2
0
0
1
,
0
1
}
,
{
2
0
1
5
,
1
2
}
,
"
W
e
e
k
"
}
O
u
t
[
1
]
=
T
i
m
e
S
e
r
i
e
s
T
i
m
e
:
0
1
J
a
n
2
0
0
1
G
M
T
-
5
t
o
2
9
N
o
v
2
0
1
5
G
M
T
-
5
D
a
t
a
p
o
i
n
t
s
:
7
9
1
Visualize the resulting time series with
D
a
t
e
L
i
s
t
P
l
o
t
:
I
n
[
2
]
:
=
D
a
t
e
L
i
s
t
P
l
o
t
d
a
t
a
,
.
.
.
O
u
t
[
2
]
=
Find the maximum and minimum temperatures over the period:
I
n
[
3
]
:
=
p
e
r
i
o
d
e
x
t
r
e
m
a
=
M
i
n
M
a
x
[
d
a
t
a
]
O
u
t
[
3
]
=
{
-
5
2
.
9
°
F
,
7
7
.
3
°
F
}
Obtain the maximum and minimum temperatures for each year:
I
n
[
4
]
:
=
y
e
a
r
e
x
t
r
e
m
a
=
M
o
v
i
n
g
M
a
p
[
M
i
n
M
a
x
,
d
a
t
a
,
{
1
y
r
,
R
i
g
h
t
,
1
y
r
}
]
O
u
t
[
4
]
=
T
i
m
e
S
e
r
i
e
s
T
i
m
e
:
0
1
J
a
n
2
0
0
2
G
M
T
-
5
t
o
0
1
J
a
n
2
0
1
5
G
M
T
-
5
D
a
t
a
p
o
i
n
t
s
:
1
4
Extract the extrema values of the first year:
I
n
[
5
]
:
=
y
e
a
r
e
x
t
r
e
m
a
[
"
F
i
r
s
t
V
a
l
u
e
"
]
O
u
t
[
5
]
=
{
-
4
5
.
°
F
,
7
7
.
1
°
F
}
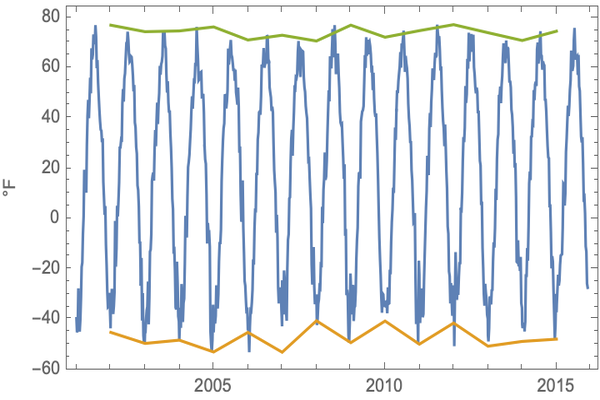
Plot their variations over the period of 15 years:
I
n
[
6
]
:
=
D
a
t
e
L
i
s
t
P
l
o
t
y
e
a
r
e
x
t
r
e
m
a
,
.
.
.
O
u
t
[
6
]
=
See Also
FrostbiteTime
Related Symbols
AirTemperatureData
Entity
MinMax
MovingMap
DateListPlot
Publisher Information
Contributed by:
Wolfram Staff