Wolfram.com
WolframAlpha.com
WolframCloud.com
Wolfram Language
Example Repository
Ready-to-use examples of Wolfram Language
Primary Navigation
Categories
Astronomy
Audio Processing
Calculus
Cellular Automata
Chemistry
Complex Systems
Computer Science
Computer Vision
Control Systems
Creative Arts
Data Science
Engineering
Finance & Economics
Finite Element Method
Food & Nutrition
Geography
Geometry
Graphs & Networks
Image Processing
Life Sciences
Machine Learning
Mathematics
Optimization
Physics
Puzzles and Recreation
Quantum Computation
Signal Processing
Social Sciences
System Modeling
Text & Language Processing
Time-Related Computation
Video Processing
Visualization & Graphics
Alphabetical List
Submit a New Example
Learn More about
Wolfram Language
Related Pages
Related Symbols
EarthquakeData
CountryData
GeoGraphics
GeoPosition
QuantityMagnitude
Related Categories
Geography
Data Science
Visualize Depth and Position of Earthquakes
Example Notebook
Open in Cloud
Download Notebook
Obtain and visualize a decade of earthquake data in Japan
Find the epicenters of all the individual earthquakes in Japan that had a magnitude of at least 3 over a decade:
I
n
[
1
]
:
=
e
v
e
n
t
s
=
Q
u
i
e
t
E
a
r
t
h
q
u
a
k
e
D
a
t
a
C
o
u
n
t
r
y
D
a
t
a
[
"
J
a
p
a
n
"
]
,
3
,
Y
e
a
r
:
2
0
0
8
,
Y
e
a
r
:
2
0
1
8
,
"
P
o
s
i
t
i
o
n
"
[
"
V
a
l
u
e
s
"
]
;
Visualize the data on the map:
I
n
[
2
]
:
=
G
e
o
G
r
a
p
h
i
c
s
[
P
o
i
n
t
[
e
v
e
n
t
s
]
]
O
u
t
[
2
]
=
Use a geo smooth histogram to show the areas with the highest frequency of earthquakes:
I
n
[
3
]
:
=
G
e
o
S
m
o
o
t
h
H
i
s
t
o
g
r
a
m
e
v
e
n
t
s
,
1
,
R
e
g
i
o
n
F
u
n
c
t
i
o
n
J
a
p
a
n
C
O
U
N
T
R
Y
,
P
l
o
t
L
e
g
e
n
d
s
A
u
t
o
m
a
t
i
c
O
u
t
[
3
]
=
Obtain the position and depth of earthquakes in the region with a magnitude of 5 or higher:
I
n
[
4
]
:
=
d
a
t
a
=
{
#
[
"
P
o
s
i
t
i
o
n
"
]
,
#
[
"
D
e
p
t
h
"
]
}
&
/
@
V
a
l
u
e
s
[
E
a
r
t
h
q
u
a
k
e
D
a
t
a
[
R
e
c
t
a
n
g
l
e
[
{
3
0
,
1
2
8
}
,
{
4
6
,
1
4
7
}
]
,
5
,
{
{
2
0
0
0
,
1
,
1
}
,
{
2
0
1
0
,
1
,
1
}
}
]
]
;
Define a function to create a line indicating the position of an earthquake beneath the surface:
I
n
[
5
]
:
=
e
q
d
e
p
t
h
[
{
G
e
o
P
o
s
i
t
i
o
n
[
{
l
a
t
_
,
l
o
n
g
_
}
]
,
d
e
p
t
h
_
}
]
:
=
W
i
t
h
[
{
e
p
i
=
{
l
o
n
g
,
l
a
t
,
-
Q
u
a
n
t
i
t
y
M
a
g
n
i
t
u
d
e
[
d
e
p
t
h
]
/
1
0
}
}
,
{
P
o
i
n
t
[
e
p
i
]
,
L
i
n
e
[
{
{
l
o
n
g
,
l
a
t
,
0
}
,
e
p
i
}
]
}
]
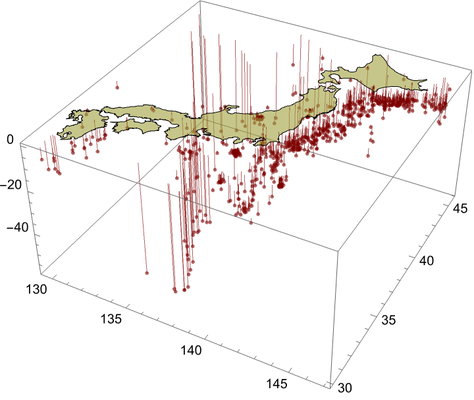
Visualize the earthquake data together with the position lines:
I
n
[
6
]
:
=
G
r
a
p
h
i
c
s
3
D
,
M
a
p
A
p
p
e
n
d
[
R
e
v
e
r
s
e
[
#
]
,
0
]
&
,
J
a
p
a
n
C
O
U
N
T
R
Y
[
"
P
o
l
y
g
o
n
"
]
/
.
G
e
o
P
o
s
i
t
i
o
n
I
d
e
n
t
i
t
y
,
{
-
2
}
,
,
e
q
d
e
p
t
h
/
@
d
a
t
a
,
O
u
t
[
6
]
=
See Also
Zoom in on Earthquakes
Analyze the Frequency and Magnitude of Earthquakes
Related Symbols
EarthquakeData
CountryData
GeoGraphics
GeoPosition
QuantityMagnitude
Publisher Information
Contributed by:
Wolfram Staff