Wolfram.com
WolframAlpha.com
WolframCloud.com
Wolfram Language
Example Repository
Ready-to-use examples of Wolfram Language
Primary Navigation
Categories
Algebra
Astronomy
Audio Processing
Calculus
Cellular Automata
Chemistry
Complex Systems
Computer Science
Computer Vision
Control Systems
Creative Arts
Data Science
Engineering
Finance & Economics
Finite Element Method
Food & Nutrition
Geography
Geometry
Graphs & Networks
Image Processing
Life Sciences
Machine Learning
Mathematics
Optimization
Physics
Probability & Statistics
Puzzles and Recreation
Quantum Computation
Signal Processing
Social Sciences
System Modeling
Tabular Processing
Text & Language Processing
Time-Related Computation
Video Processing
Visualization & Graphics
Alphabetical List
Submit a New Example
Learn More about
Wolfram Language
Related Pages
Related Symbols
EarthquakeData
CountryData
GeoGraphics
GeoPosition
QuantityMagnitude
Related Categories
Geography
Data Science
Depth and Position of Earthquakes
Obtain and visualize a decade of earthquake data in Japan
Example Notebook
Open in Cloud
Download Notebook
Find the epicenters of all the individual earthquakes in Japan that had a magnitude of at least 3 over a decade:
I
n
[
1
]
:
=
e
v
e
n
t
s
=
Q
u
i
e
t
E
a
r
t
h
q
u
a
k
e
D
a
t
a
C
o
u
n
t
r
y
D
a
t
a
[
"
J
a
p
a
n
"
]
,
3
,
Y
e
a
r
:
2
0
0
8
,
Y
e
a
r
:
2
0
1
8
,
"
P
o
s
i
t
i
o
n
"
[
"
V
a
l
u
e
s
"
]
;
Visualize the data on the map:
I
n
[
2
]
:
=
G
e
o
G
r
a
p
h
i
c
s
[
P
o
i
n
t
[
e
v
e
n
t
s
]
]
O
u
t
[
2
]
=
Use a geo smooth histogram to show the areas with the highest frequency of earthquakes:
I
n
[
3
]
:
=
G
e
o
S
m
o
o
t
h
H
i
s
t
o
g
r
a
m
e
v
e
n
t
s
,
1
,
R
e
g
i
o
n
F
u
n
c
t
i
o
n
J
a
p
a
n
C
O
U
N
T
R
Y
,
P
l
o
t
L
e
g
e
n
d
s
A
u
t
o
m
a
t
i
c
O
u
t
[
3
]
=
Obtain the position and depth of earthquakes in the region with a magnitude of 5 or higher:
I
n
[
4
]
:
=
d
a
t
a
=
{
#
[
"
P
o
s
i
t
i
o
n
"
]
,
#
[
"
D
e
p
t
h
"
]
}
&
/
@
V
a
l
u
e
s
[
E
a
r
t
h
q
u
a
k
e
D
a
t
a
[
R
e
c
t
a
n
g
l
e
[
{
3
0
,
1
2
8
}
,
{
4
6
,
1
4
7
}
]
,
5
,
{
{
2
0
0
0
,
1
,
1
}
,
{
2
0
1
0
,
1
,
1
}
}
]
]
;
Define a function to create a line indicating the position of an earthquake beneath the surface:
I
n
[
5
]
:
=
e
q
d
e
p
t
h
[
{
G
e
o
P
o
s
i
t
i
o
n
[
{
l
a
t
_
,
l
o
n
g
_
}
]
,
d
e
p
t
h
_
}
]
:
=
W
i
t
h
[
{
e
p
i
=
{
l
o
n
g
,
l
a
t
,
-
Q
u
a
n
t
i
t
y
M
a
g
n
i
t
u
d
e
[
d
e
p
t
h
]
/
1
0
}
}
,
{
P
o
i
n
t
[
e
p
i
]
,
L
i
n
e
[
{
{
l
o
n
g
,
l
a
t
,
0
}
,
e
p
i
}
]
}
]
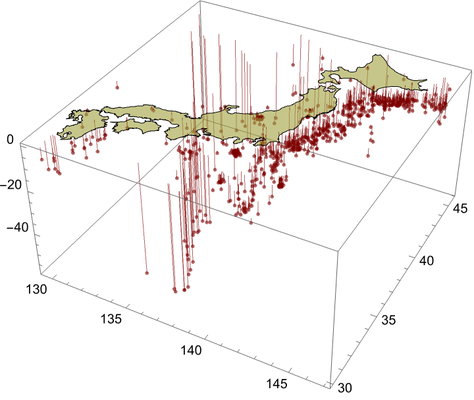
Visualize the earthquake data together with the position lines:
I
n
[
6
]
:
=
G
r
a
p
h
i
c
s
3
D
,
M
a
p
A
p
p
e
n
d
[
R
e
v
e
r
s
e
[
#
]
,
0
]
&
,
J
a
p
a
n
C
O
U
N
T
R
Y
[
"
P
o
l
y
g
o
n
"
]
/
.
G
e
o
P
o
s
i
t
i
o
n
I
d
e
n
t
i
t
y
,
{
-
2
}
,
,
e
q
d
e
p
t
h
/
@
d
a
t
a
,
O
u
t
[
6
]
=
See Also
Zoom in on Earthquakes
Analyze the Frequency and Magnitude of Earthquakes
Related Symbols
EarthquakeData
CountryData
GeoGraphics
GeoPosition
QuantityMagnitude
Publisher Information
Contributed by:
Wolfram Staff