Wolfram.com
WolframAlpha.com
WolframCloud.com
Wolfram Language
Example Repository
Ready-to-use examples of Wolfram Language
Primary Navigation
Categories
Algebra
Astronomy
Audio Processing
Calculus
Cellular Automata
Chemistry
Complex Systems
Computer Science
Computer Vision
Control Systems
Creative Arts
Data Science
Engineering
Finance & Economics
Finite Element Method
Food & Nutrition
Geography
Geometry
Graphs & Networks
Image Processing
Life Sciences
Machine Learning
Mathematics
Optimization
Physics
Probability & Statistics
Puzzles and Recreation
Quantum Computation
Signal Processing
Social Sciences
System Modeling
Tabular Processing
Text & Language Processing
Time-Related Computation
Video Processing
Visualization & Graphics
Alphabetical List
Submit a New Example
Learn More about
Wolfram Language
Related Pages
Related Symbols
Tabular
ColumnTypes
TransformColumns
GeoRegionValuePlot
Related Categories
Social Sciences
Data Science
Tabular Processing
Population Density of G10 Countries
Example Notebook
Open in Cloud
Download Notebook
The Group of Ten (G10) was created in 1962, when ten countries agreed to contribute additional resources to the International Monetary Fund. It grew to 11 countries in 1964.
Get data about the 11 countries of the G10 group:
I
n
[
1
]
:
=
d
a
t
a
=
E
n
t
i
t
y
V
a
l
u
e
[
E
n
t
i
t
y
C
l
a
s
s
[
"
C
o
u
n
t
r
y
"
,
"
G
r
o
u
p
O
f
1
0
"
]
,
E
n
t
i
t
y
F
u
n
c
t
i
o
n
[
e
,
{
I
n
t
e
r
p
r
e
t
e
r
[
"
C
o
u
n
t
r
y
"
]
@
e
[
"
N
a
m
e
"
]
,
e
[
"
C
a
p
i
t
a
l
C
i
t
y
"
]
,
e
[
"
F
l
a
g
"
]
,
e
[
"
A
r
e
a
"
]
,
e
[
"
P
o
p
u
l
a
t
i
o
n
"
]
}
]
]
;
C
r
e
a
t
e
a
f
i
v
e
-
c
o
l
u
m
n
T
a
b
u
l
a
r
o
b
j
e
c
t
f
r
o
m
t
h
e
d
a
t
a
:
I
n
[
2
]
:
=
g
1
0
=
T
a
b
u
l
a
r
d
a
t
a
,
c
o
l
u
m
n
k
e
y
s
O
u
t
[
2
]
=
Show the data type and units of each column:
I
n
[
3
]
:
=
C
o
l
u
m
n
T
y
p
e
s
[
g
1
0
]
O
u
t
[
3
]
=
G
1
0
c
o
u
n
t
r
y
E
n
t
i
t
y
:
:
[
C
o
u
n
t
r
y
,
S
t
r
i
n
g
]
,
c
a
p
i
t
a
l
E
n
t
i
t
y
:
:
[
C
i
t
y
,
L
i
s
t
V
e
c
t
o
r
:
:
[
S
t
r
i
n
g
,
3
]
]
,
f
l
a
g
I
n
e
r
t
E
x
p
r
e
s
s
i
o
n
,
a
r
e
a
Q
u
a
n
t
i
t
y
:
:
[
R
e
a
l
E
x
p
r
e
s
s
i
o
n
,
2
M
i
l
e
s
]
,
p
o
p
u
l
a
t
i
o
n
Q
u
a
n
t
i
t
y
:
:
[
I
n
t
e
g
e
r
6
4
,
P
e
o
p
l
e
]
Compute a population density column and add it after the "capital" column:
I
n
[
4
]
:
=
g
1
0
D
e
n
s
i
t
y
=
T
r
a
n
s
f
o
r
m
C
o
l
u
m
n
s
[
g
1
0
,
{
"
c
a
p
i
t
a
l
"
,
"
d
e
n
s
i
t
y
"
F
u
n
c
t
i
o
n
[
#
p
o
p
u
l
a
t
i
o
n
/
#
a
r
e
a
]
}
]
O
u
t
[
4
]
=
Extract the capitals as a list of entities:
I
n
[
5
]
:
=
c
a
p
i
t
a
l
s
=
N
o
r
m
a
l
[
g
1
0
D
e
n
s
i
t
y
〚
A
l
l
,
"
c
a
p
i
t
a
l
"
〛
]
O
u
t
[
5
]
=
B
r
u
s
s
e
l
s
,
O
t
t
a
w
a
,
P
a
r
i
s
,
B
e
r
l
i
n
,
R
o
m
e
,
T
o
k
y
o
,
A
m
s
t
e
r
d
a
m
,
S
t
o
c
k
h
o
l
m
,
B
e
r
n
,
L
o
n
d
o
n
,
W
a
s
h
i
n
g
t
o
n
Show the capitals on a map:
I
n
[
6
]
:
=
G
e
o
L
i
s
t
P
l
o
t
[
c
a
p
i
t
a
l
s
]
O
u
t
[
6
]
=
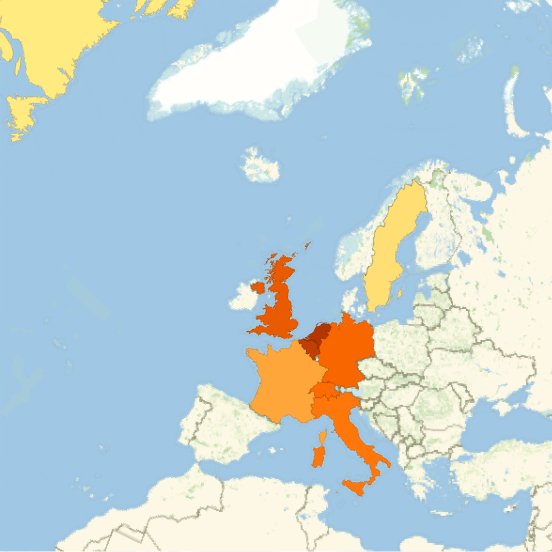
Shade each country by its population density:
I
n
[
7
]
:
=
G
e
o
R
e
g
i
o
n
V
a
l
u
e
P
l
o
t
[
N
o
r
m
a
l
[
g
1
0
D
e
n
s
i
t
y
〚
A
l
l
,
"
G
1
0
c
o
u
n
t
r
y
"
〛
]
N
o
r
m
a
l
[
g
1
0
D
e
n
s
i
t
y
〚
A
l
l
,
"
d
e
n
s
i
t
y
"
〛
]
]
O
u
t
[
7
]
=
Related Symbols
Tabular
ColumnTypes
TransformColumns
GeoRegionValuePlot
Publisher Information
Contributed by:
Wolfram Research