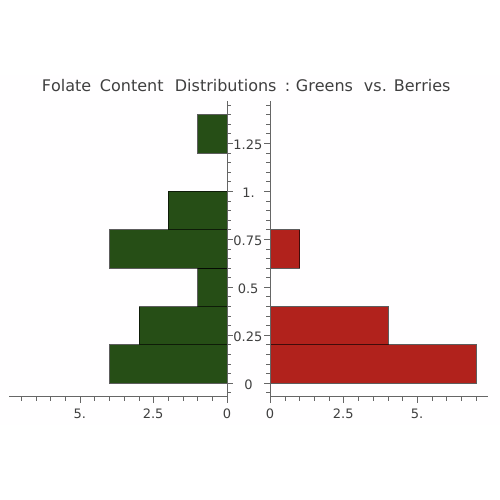
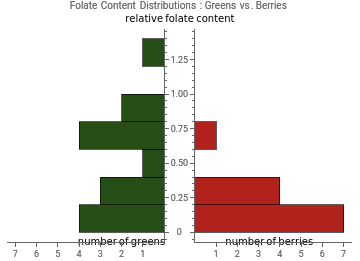
Folate is an essential nutrient involved in DNA synthesis and cell growth. Compare folate levels in berries and green vegetables using statistics.
Define two groups of Food entities, berries and green vegetables:
In[1]:=
berries=
food
foodtype
:exactly
strawberry
FOODTYPE
addedfoodtypes
:exactlynone
,
food
foodtype
:exactly
blueberry
FOODTYPE
addedfoodtypes
:exactlynone
,
food
,
food
,
food
,
food
,
food
,
food
,
food
,
food
,
food
,
food
,
food
,
food
,
food
,
food
;greens=
food
foodtype
:exactly
spinach
FOODTYPE
addedfoodtypes
:exactlynone
,
food
foodtype
:exactly
kale
FOODTYPE
addedfoodtypes
:exactlynone
,
food
,
food
,
food
,
food
,
food
,
food
,
food
,
food
,
food
,
food
,
food
,
food
,
food
,
food
;
Retrieve the folate values for each food group by querying the corresponding entity property, removing missing entries, and converting any quantity-valued results into plain numerical values suitable for statistical analysis:
Compute basic descriptive statistics for each group ( Min, Max, Mean, Median, Variance and StandardDeviation ) to summarize and compare the overall distribution and variability of folate levels in berries and green vegetables:
At this stage, one might want to use TrimmedMean to remove data outliers that may be skewing a result, such as the outlying 10% of data from both ends of the distribution:
In[7]:=
N[TrimmedMean[berriesFolate,0.10]]
Out[7]=
0.146
In[8]:=
N[TrimmedMean[greensFolate,0.10]]
Out[8]=
0.512308
To compare the mean folate content of berries and green vegetables, we use a two-sample TTest. This test is designed to determine whether the means of two independent groups differ in a statistically meaningful way. It assumes that the data in each group are approximately normally distributed and that the population variances are unknown.
Before applying the t-test, we check whether the normality assumption is reasonable for each group.
To assess normality, we apply DistributionFitTest separately to each group using a default significance level 𝛼 = 0.05. The test returns a p-value, which is compared to 𝛼. If the p-value is greater than 𝛼, we do not have strong evidence to reject the null hypothesis (that the data come from a normal distribution). If the p-value is below 𝛼, the null hypothesis is rejected, indicating that the normality assumption may be questionable:
After testing normality of the data, we evaluate whether the observed difference in mean folate content between berries and green vegetables is statistically significant using the t-test introduced above. The test output includes a p-value quantifying the strength of the evidence, along with short textual conclusions summarizing the result: