Wolfram.com
WolframAlpha.com
WolframCloud.com
Wolfram Language
Example Repository
Ready-to-use examples of Wolfram Language
Primary Navigation
Categories
Algebra
Astronomy
Audio Processing
Calculus
Cellular Automata
Chemistry
Complex Systems
Computer Science
Computer Vision
Control Systems
Creative Arts
Data Science
Engineering
Finance & Economics
Finite Element Method
Food & Nutrition
Geography
Geometry
Graphs & Networks
Image Processing
Life Sciences
Machine Learning
Mathematics
Optimization
Physics
Probability & Statistics
Puzzles and Recreation
Quantum Computation
Signal Processing
Social Sciences
System Modeling
Tabular Processing
Text & Language Processing
Time-Related Computation
Video Processing
Visualization & Graphics
Alphabetical List
Submit a New Example
Learn More about
Wolfram Language
Related Pages
Related Symbols
AudioLocalMeasurements
AudioChannelMix
AudioBlockMap
Related Categories
Audio Processing
RMS Amplitude of Audio Signals
Compute and visualize local measurements of audio signals
Example Notebook
Open in Cloud
Download Notebook
Start by down-mixing a audio signal in to a single channel:
I
n
[
1
]
:
=
a
=
A
u
d
i
o
C
h
a
n
n
e
l
M
i
x
[
E
x
a
m
p
l
e
D
a
t
a
[
{
"
A
u
d
i
o
"
,
"
M
a
l
e
V
o
i
c
e
"
}
,
"
A
u
d
i
o
"
]
,
1
]
;
Compute the
"
N
o
v
e
l
t
y
"
,
"
H
i
g
h
F
r
e
q
u
e
n
c
y
C
o
n
t
e
n
t
"
and
"
S
p
e
c
t
r
a
l
C
e
n
t
r
o
i
d
"
of the signal, computed on short-time Fourier data:
I
n
[
2
]
:
=
p
r
o
p
e
r
t
i
e
s
=
A
u
d
i
o
L
o
c
a
l
M
e
a
s
u
r
e
m
e
n
t
s
[
a
,
{
"
N
o
v
e
l
t
y
"
,
"
H
i
g
h
F
r
e
q
u
e
n
c
y
C
o
n
t
e
n
t
"
,
"
S
p
e
c
t
r
a
l
C
e
n
t
r
o
i
d
"
}
]
O
u
t
[
2
]
=
N
o
v
e
l
t
y
T
i
m
e
S
e
r
i
e
s
T
i
m
e
:
0
.
t
o
2
.
3
7
D
a
t
a
p
o
i
n
t
s
:
5
2
,
H
i
g
h
F
r
e
q
u
e
n
c
y
C
o
n
t
e
n
t
T
i
m
e
S
e
r
i
e
s
T
i
m
e
:
0
.
t
o
2
.
3
7
D
a
t
a
p
o
i
n
t
s
:
5
2
,
S
p
e
c
t
r
a
l
C
e
n
t
r
o
i
d
T
i
m
e
S
e
r
i
e
s
T
i
m
e
:
0
.
t
o
2
.
3
7
D
a
t
a
p
o
i
n
t
s
:
5
2
Visualize the properties together with the spectrogram of the audio:
I
n
[
3
]
:
=
S
h
o
w
S
p
e
c
t
r
o
g
r
a
m
[
a
]
,
L
i
s
t
L
i
n
e
P
l
o
t
R
e
s
c
a
l
e
[
#
,
M
i
n
M
a
x
[
#
]
,
{
0
,
1
0
0
0
0
}
]
&
/
@
p
r
o
p
e
r
t
i
e
s
,
.
.
.
,
.
.
.
O
u
t
[
3
]
=
N
o
v
e
l
t
y
H
i
g
h
F
r
e
q
u
e
n
c
y
C
o
n
t
e
n
t
S
p
e
c
t
r
a
l
C
e
n
t
r
o
i
d
Next define a color function to visualize the dB RMS amplitude:
I
n
[
4
]
:
=
d
b
L
o
u
d
n
e
s
s
[
p
a
r
t
i
t
i
o
n
_
]
:
=
2
0
L
o
g
1
0
[
S
q
r
t
@
M
e
a
n
[
p
a
r
t
i
t
i
o
n
^
2
]
+
1
0
^
-
6
]
;
c
o
l
o
r
[
x
_
]
:
=
B
l
e
n
d
-
4
0
,
,
-
3
5
,
,
-
5
,
,
x
;
Use the function to compute the resulting colors:
I
n
[
5
]
:
=
A
u
d
i
o
B
l
o
c
k
M
a
p
[
F
u
n
c
t
i
o
n
[
p
a
r
t
,
c
o
l
o
r
[
d
b
L
o
u
d
n
e
s
s
[
p
a
r
t
]
]
]
,
#
,
{
.
1
,
.
1
,
H
a
n
n
W
i
n
d
o
w
}
]
&
[
a
]
[
"
V
a
l
u
e
s
"
]
/
/
A
r
r
a
y
P
l
o
t
{
#
}
,
o
p
t
s
&
O
u
t
[
5
]
=
Next get a collection of audio signals to compute the same properties:
I
n
[
6
]
:
=
a
u
d
i
o
s
=
A
s
s
o
c
i
a
t
i
o
n
M
a
p
[
A
u
d
i
o
C
h
a
n
n
e
l
M
i
x
[
E
x
a
m
p
l
e
D
a
t
a
[
{
"
A
u
d
i
o
"
,
#
}
]
,
1
]
&
,
E
x
a
m
p
l
e
D
a
t
a
[
"
A
u
d
i
o
"
]
〚
;
;
1
5
,
2
〛
]
;
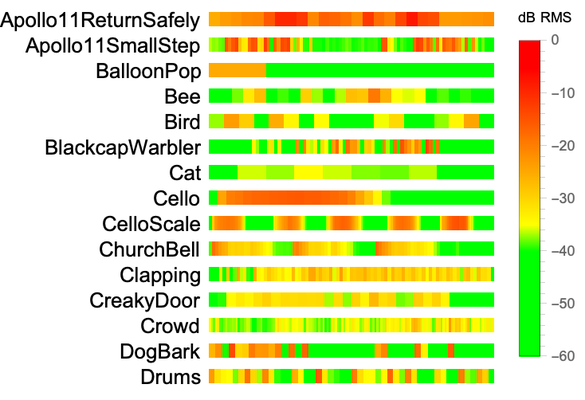
Visualize the dB RMS amplitude of the collection of audio objects:
I
n
[
7
]
:
=
C
o
l
u
m
n
K
e
y
V
a
l
u
e
M
a
p
L
a
b
e
l
e
d
A
r
r
a
y
P
l
o
t
{
#
2
[
"
V
a
l
u
e
s
"
]
}
,
o
p
t
s
,
T
e
x
t
@
#
1
,
L
e
f
t
&
,
(
A
u
d
i
o
B
l
o
c
k
M
a
p
[
F
u
n
c
t
i
o
n
[
p
a
r
t
,
c
o
l
o
r
[
d
b
L
o
u
d
n
e
s
s
[
p
a
r
t
]
]
]
,
#
,
{
.
1
,
.
1
,
H
a
n
n
W
i
n
d
o
w
}
]
&
/
@
a
u
d
i
o
s
)
,
o
p
t
s
/
/
l
e
g
e
n
d
O
u
t
[
7
]
=
Related Symbols
AudioLocalMeasurements
AudioChannelMix
AudioBlockMap
Publisher Information
Contributed by:
Wolfram Staff