Wolfram.com
WolframAlpha.com
WolframCloud.com
Wolfram Language
Example Repository
Ready-to-use examples of Wolfram Language
Primary Navigation
Categories
Algebra
Astronomy
Audio Processing
Calculus
Cellular Automata
Chemistry
Complex Systems
Computer Science
Computer Vision
Control Systems
Creative Arts
Data Science
Engineering
Finance & Economics
Finite Element Method
Food & Nutrition
Geography
Geometry
Graphs & Networks
Image Processing
Life Sciences
Machine Learning
Mathematics
Optimization
Physics
Probability & Statistics
Puzzles and Recreation
Quantum Computation
Signal Processing
Social Sciences
System Modeling
Tabular Processing
Text & Language Processing
Time-Related Computation
Video Processing
Visualization & Graphics
Alphabetical List
Submit a New Example
Learn More about
Wolfram Language
Related Pages
Related Symbols
VideoMapTimeSeries
ImageMeasurements
FindPeaks
Related Categories
Creative Arts
Image Processing
Video Processing
Signal Processing
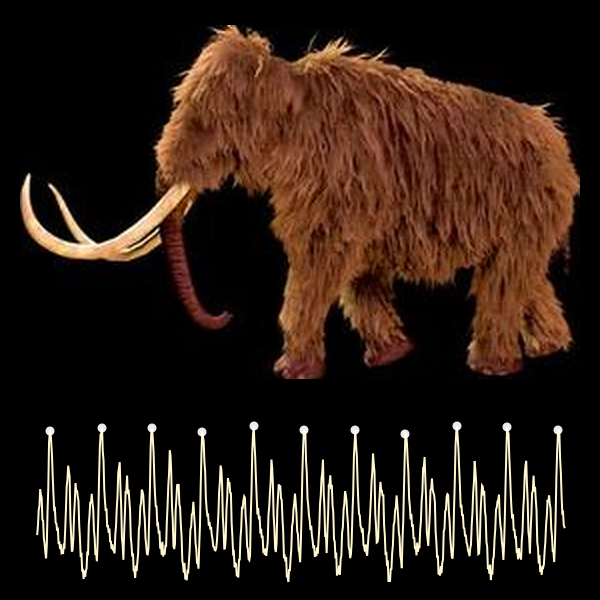
Find the Period of the Gait of an Animated Woolly Mammoth
Find the period of the gait of an animated mammoth
Example Notebook
Open in Cloud
Download Notebook
In this example, we will use a video of a wooly mammoth to track its location. The centroid of its mass will be used to estimate the period of the mammoth's gait.
Import the video and acquire important information:
I
n
[
1
]
:
=
v
i
d
e
o
=
V
i
d
e
o
[
"
h
t
t
p
s
:
/
/
c
d
n
.
p
i
x
a
b
a
y
.
c
o
m
/
v
i
d
e
o
/
2
0
1
6
/
1
1
/
1
5
/
6
4
2
6
-
1
9
1
7
2
3
6
9
1
_
l
a
r
g
e
.
m
p
4
"
]
O
u
t
[
1
]
=
I
n
[
2
]
:
=
{
s
a
m
p
l
i
n
g
r
a
t
e
,
f
r
a
m
e
c
o
u
n
t
,
d
u
r
a
t
i
o
n
}
=
I
n
f
o
r
m
a
t
i
o
n
[
v
i
d
e
o
,
{
"
F
r
a
m
e
R
a
t
e
"
,
"
F
r
a
m
e
C
o
u
n
t
"
,
"
D
u
r
a
t
i
o
n
"
}
]
/
.
a
_
A
s
s
o
c
i
a
t
i
o
n
a
[
1
]
O
u
t
[
2
]
=
{
3
0
f
r
a
m
e
s
/
s
,
7
1
7
,
2
3
.
9
s
}
Binarize the video and extract the intensity centroid of the wooly mammoth:
I
n
[
3
]
:
=
t
s
=
V
i
d
e
o
M
a
p
T
i
m
e
S
e
r
i
e
s
[
I
m
a
g
e
M
e
a
s
u
r
e
m
e
n
t
s
[
B
i
n
a
r
i
z
e
[
#
I
m
a
g
e
,
.
0
1
]
,
"
I
n
t
e
n
s
i
t
y
C
e
n
t
r
o
i
d
"
]
&
,
v
i
d
e
o
]
O
u
t
[
3
]
=
T
i
m
e
S
e
r
i
e
s
T
i
m
e
:
0
.
0
1
6
7
t
o
2
3
.
9
D
a
t
a
p
o
i
n
t
s
:
7
1
7
I
n
[
4
]
:
=
c
e
n
t
r
o
i
d
s
=
t
s
[
"
V
a
l
u
e
s
"
]
;
Plot the position of the centroid of the moving mammoth:
I
n
[
5
]
:
=
L
i
s
t
L
i
n
e
P
l
o
t
[
c
e
n
t
r
o
i
d
s
,
P
l
o
t
R
a
n
g
e
{
{
0
,
1
9
2
0
}
,
{
2
4
0
,
2
4
6
}
}
,
F
r
a
m
e
T
r
u
e
]
O
u
t
[
5
]
=
Compute the peaks of y coordinates of the centroids:
I
n
[
6
]
:
=
h
e
i
g
h
t
s
=
c
e
n
t
r
o
i
d
s
〚
A
l
l
,
2
〛
;
I
n
[
7
]
:
=
p
e
a
k
s
=
F
i
n
d
P
e
a
k
s
h
e
i
g
h
t
s
,
Q
u
a
n
t
i
t
y
M
a
g
n
i
t
u
d
e
[
s
a
m
p
l
i
n
g
r
a
t
e
]
2
;
Show the centroid heights as well as the detected peaks:
I
n
[
8
]
:
=
L
i
s
t
L
i
n
e
P
l
o
t
[
h
e
i
g
h
t
s
,
E
p
i
l
o
g
{
R
e
d
,
P
o
i
n
t
[
p
e
a
k
s
]
}
]
O
u
t
[
8
]
=
Compute the mean difference between peaks as a measure of time period:
I
n
[
9
]
:
=
M
e
a
n
[
Q
u
a
n
t
i
t
y
[
D
i
f
f
e
r
e
n
c
e
s
[
p
e
a
k
s
〚
A
l
l
,
1
〛
]
,
"
F
r
a
m
e
s
"
]
/
s
a
m
p
l
i
n
g
r
a
t
e
]
/
/
N
O
u
t
[
9
]
=
2
.
3
0
3
3
3
s
Related Symbols
VideoMapTimeSeries
ImageMeasurements
FindPeaks
Publisher Information
Contributed by:
Ali Hashmi