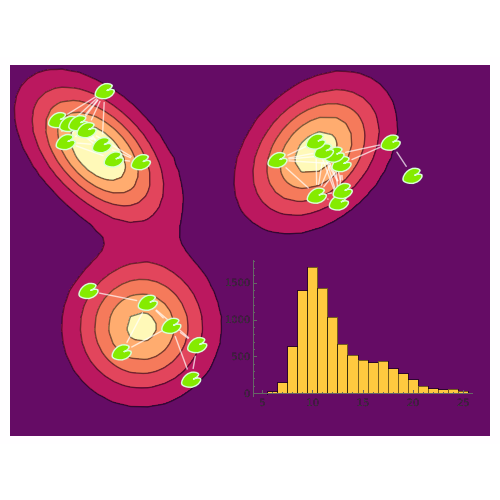
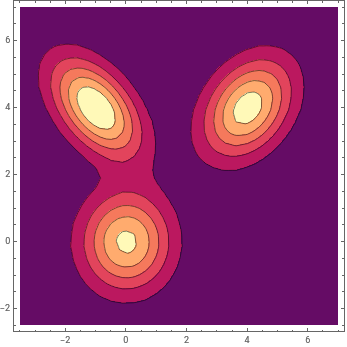
A frog in a lily pond is able to jump 1.5 feet to get from one of the 25 lily pads to another. Model the frog's jumping network from a lily leaf density function and
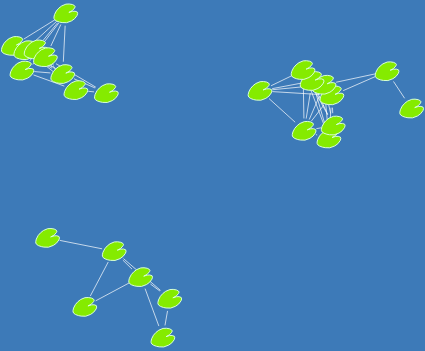
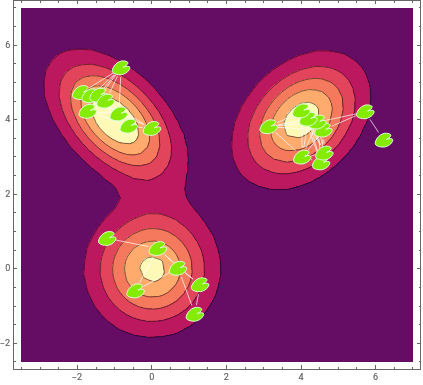
Define a spatial graph distribution (a random graph model where vertices are placed in space according to a density). Edges occur only between vertices closer to one another than the 1.5 foot jumping distance:
Draw 10 random samples from the distribution of largest connected component sizes, showing how many lily pads typically belong to the biggest group in different simulated ponds:
In[8]:=
RandomVariate[largestIsland,10]
Out[8]=
{10,13,18,10,17,11,13,11,17,10}
Plot a histogram of the distribution of this statistic over 10,000 simulated ponds: