Wolfram.com
WolframAlpha.com
WolframCloud.com
Wolfram Language
Example Repository
Ready-to-use examples of Wolfram Language
Primary Navigation
Categories
Algebra
Astronomy
Audio Processing
Calculus
Cellular Automata
Chemistry
Complex Systems
Computer Science
Computer Vision
Control Systems
Creative Arts
Data Science
Engineering
Finance & Economics
Finite Element Method
Food & Nutrition
Geography
Geometry
Graphs & Networks
Image Processing
Life Sciences
Machine Learning
Mathematics
Optimization
Physics
Probability & Statistics
Puzzles and Recreation
Quantum Computation
Signal Processing
Social Sciences
System Modeling
Tabular Processing
Text & Language Processing
Time-Related Computation
Video Processing
Visualization & Graphics
Alphabetical List
Submit a New Example
Learn More about
Wolfram Language
Related Pages
Related Symbols
ToTabular
TransformColumns
PivotToColumns
Related Categories
Geography
Data Science
Tabular Processing
Track the Water Level in Lake Mead
Transform and visualize tabular data
Example Notebook
Open in Cloud
Download Notebook
Lake Mead was created in 1935, as the Hoover Dam neared completion:
I
n
[
1
]
:
=
H
o
o
v
e
r
D
a
m
H
I
S
T
O
R
I
C
S
I
T
E
[
"
C
o
m
p
l
e
t
i
o
n
D
a
t
e
"
]
O
u
t
[
1
]
=
Y
e
a
r
:
1
9
3
6
Get a time series of Lake Mead's water levels:
I
n
[
2
]
:
=
t
s
=
T
i
m
e
S
e
r
i
e
s
T
i
m
e
:
3
1
J
a
n
1
9
3
5
t
o
3
0
J
u
n
2
0
2
4
D
a
t
a
p
o
i
n
t
s
:
1
0
7
4
;
Create a
Tabular
object from the time series:
I
n
[
3
]
:
=
t
a
b
1
=
T
o
T
a
b
u
l
a
r
[
t
s
,
"
T
i
m
e
S
e
r
i
e
s
"
]
O
u
t
[
3
]
=
Split the dates into year and month columns and remove the "Date" column:
I
n
[
4
]
:
=
t
a
b
2
=
T
r
a
n
s
f
o
r
m
C
o
l
u
m
n
s
[
t
a
b
1
,
{
"
Y
e
a
r
"
F
u
n
c
t
i
o
n
[
D
a
t
e
V
a
l
u
e
[
#
D
a
t
e
,
"
Y
e
a
r
"
]
]
,
"
M
o
n
t
h
"
F
u
n
c
t
i
o
n
[
D
a
t
e
V
a
l
u
e
[
#
D
a
t
e
,
"
M
o
n
t
h
N
a
m
e
"
]
]
,
"
D
a
t
e
"
N
o
t
h
i
n
g
}
]
O
u
t
[
4
]
=
Use
PivotToColumns
to convert the object into a more compact and readable chart:
I
n
[
5
]
:
=
t
a
b
3
=
P
i
v
o
t
T
o
C
o
l
u
m
n
s
[
t
a
b
2
,
"
M
o
n
t
h
"
"
V
a
l
u
e
"
]
O
u
t
[
5
]
=
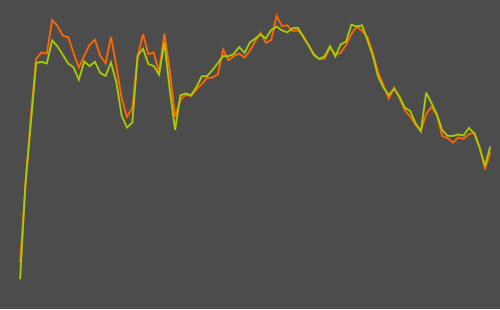
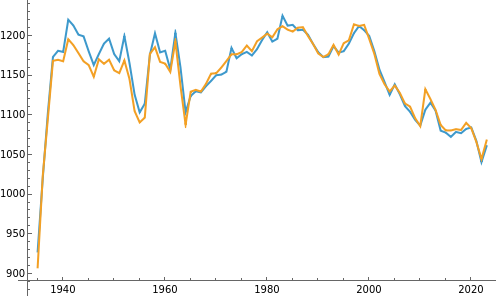
Plot the water levels in July and December of each year:
I
n
[
6
]
:
=
L
i
s
t
L
i
n
e
P
l
o
t
[
t
a
b
3
{
{
"
Y
e
a
r
"
,
"
J
u
l
y
"
}
,
{
"
Y
e
a
r
"
,
"
D
e
c
e
m
b
e
r
"
}
}
]
O
u
t
[
6
]
=
External Links
Lake Mead
Related Symbols
ToTabular
TransformColumns
PivotToColumns
Publisher Information
Contributed by:
Wolfram Research