Linear correlation measures the strength and direction of a linear relationship between two quantitative variables. A positive correlation indicates that higher values of one variable tend to be associated with higher values of the other, while a negative correlation indicates an inverse association. In this example, we examine whether meats with higher fat content also tend to have higher calorie density.
Define a collection of meat food entities, then extract their relative fat content and calorie density. The values are converted to plain numerical magnitudes so they can be directly compared, plotted, and analyzed statistically:
The upward trend in the scatter plot suggests a positive linear association: meats with higher fat content tend to have higher calorie density. A downward trend would indicate a negative linear association, while a diffuse cloud with no clear direction would suggest little to no linear relationship.
The correlation coefficient measures the direction and strength of a linear relationship between two variables, taking values in range[-1, 1]. Values closer to ±1 indicate stronger linear association, while values near 0 indicate weak linear association. The interpretation of magnitude depends on context and data variability.
Get the correlation coefficient with the Correlation function:
In[7]:=
Correlation[meatsFat,meatsCalories]
Out[7]=
0.982809
This value indicates a strong positive linear association between fat content and calorie density in this sample of meats. As a second analysis using the same dataset, examine the relationship between saturated fat and monounsaturated fat in meats. Instead of distribution-based summaries, use linear regression to model how one fat component varies with the other.
Prepare the data by extracting saturated and monounsaturated fat values for each meat, converting them to numerical form, and pairing them for regression analysis:
Compute the correlation coefficient for reference:
In[9]:=
Correlation[meatsSatFat,meatsMonounsatFat]
Out[9]=
0.902701
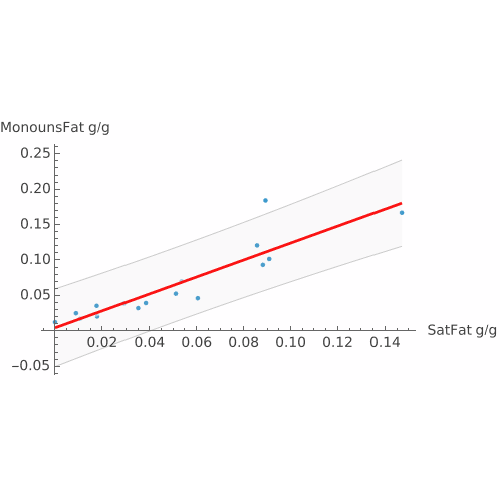
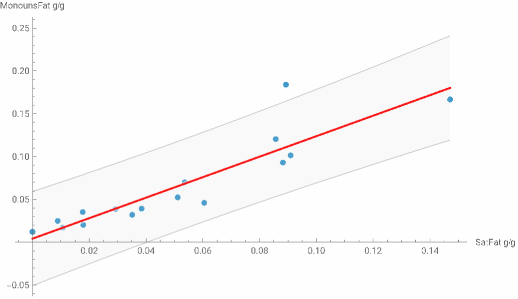
Fit a linear regression model to the paired saturated and monounsaturated fat data and visualize the fitted line together with the observed data points, include a 95% confidence band:
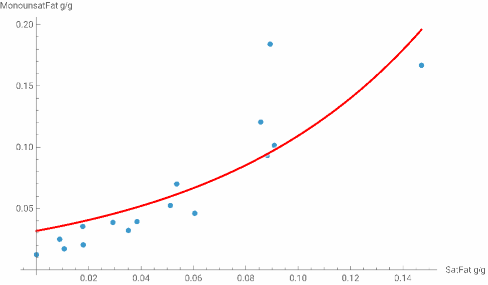
To assess whether a different functional form provides a better description of the data, compare the linear model with alternative regression fits. First try an exponential: